

HOT TOPICS LIST
- MACD
- Fibonacci
- RSI
- Gann
- ADXR
- Stochastics
- Volume
- Triangles
- Futures
- Cycles
- Volatility
- ZIGZAG
- MESA
- Retracement
- Aroon
INDICATORS LIST
LIST OF TOPICS
PRINT THIS ARTICLE
by David Penn
Is the unease surrounding the 2000 presidential election a good thing for the Dow Jones Utilities Average?
Position: N/A
David Penn
Technical Writer for Technical Analysis of STOCKS & COMMODITIES magazine, Working-Money.com, and Traders.com Advantage.
PRINT THIS ARTICLE
ASCENDING TRIANGLES
E2K and Ascending Triangles
12/14/00 01:45:48 PMby David Penn
Is the unease surrounding the 2000 presidential election a good thing for the Dow Jones Utilities Average?
Position: N/A
| When the Supreme Court handed down its ruling that finally assured a presidential victory for George W. Bush, the markets--which have spent most of E2K advancing on news favorable to Bush--slumped, particularly the Nasdaq. If "slumped" is too strong to describe the Dow Jones' less than one half of 1% rise and nearly a 4% drop in the Nasdaq on Wednesday, then so be it. But the Bush bulls who throttled the futures markets when Bush looked likely to close the deal less than a week ago seem to be strangely absent now that Bush, for all intents and purposes, is in. |
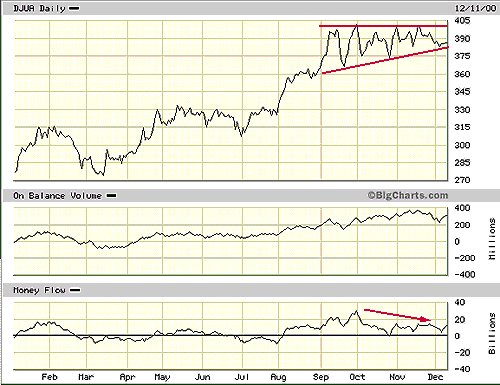
| All this makes it easy to revisit both the possibility of a harder than soft landing in the financial markets, and the prognosis of everyone's favorite defensive sector, utilities. The economic slowdown in the U.S.--combined with record-setting energy use and high oil prices--has helped the Dow Jones Utilities Average post major gains in 2000. The DJUA moved from a year-to-date low of about 270 this spring to highs of 400 by autumn, a tremendous gain of 48%. Presently, the DJUA has consolidated in a pattern of consistent highs and higher lows, a formation that, beginning in September, is developing into an ascending triangle. The fact that ascending triangles tend to augur bullish consolidations suggests quite a bit about not only the near-term future of the DJUA, but also hints at whether the financial skies in the coming year will start out fair or foul. |
|
| If the ascending triangle formation in the Dow Jones Utilities Average is successful, the breakout should push the Average to all-time highs. Money flow points to the necessary volume trend. But on-balance volume is less conclusive. |
| Graphic provided by: Bigcharts.com. |
| |
| An ascending triangle is a chart formation characterized by a flat, horizontal top and a bottom that slopes upward. In terms of prices, an ascending triangle has relatively constant highs, but the lows are getting higher and higher. In an ascending triangle, prices appear to have run into topside resistance, even though the range of prices is diminishing. Pressure to move prices higher tends to build until, finally, there is an upside breakout. As such, ascending triangle formations are considered bullish consolidations, anticipating higher prices and usually coming on the end of an overall price advance. Volume during the formation tends to trend downward as the pattern develops, then usually increases dramatically on the breakout, as prices rise and move away from the triangle. |
| The ascending triangle in the Dow Jones Utilities Average is especially interesting insofar as it comes at the Average's all-time top, meaning that the bullish consolidation the pattern usually anticipates would take the DJUA into historic, new high territory. Looking at the year-to-date chart of the DJUA, the ascending triangle that began forming in September 2000 is clear. The flat, horizontal top of the triangle is at about 400, and the up-sloping leg of the triangle begins with the September low at about 367, continues to the somewhat higher October low at 375, and meets price action in December just north of 380. On-balance volume (OBV), as one indicator of the volume trend, is not especially suggestive, rising slightly from September to November. But the money flow indicator reveals current levels down significantly from their late September peak, which may help establish at least a partial case for the downward volume trend that generally accompanies ascending triangles. |
| One of the problems with ascending triangles, as far as Thomas Bulkowski, author of ENCYCLOPEDIA OF CHART PATTERNS, is concerned, is that there is no real way to tell a false breakout from a real one. Given the measurement rules he suggests--adding the height of the triangle to the horizontal top--an upside of 435 is not an unreasonable near-term target for the DJUA. But what is almost more interesting than the fate of the DJUA itself is the question of what a utilities average that is making all-time new highs might mean for the rest of the market. Investing in utilities is widely considered to be a defensive move (people will always need electricity, so the saying goes. And utilities' stocks tend to pay dividends more than other stocks.) A major flow of investor dollars into utilities at this point would seem to suggest less confidence in the markets in general than might otherwise be believed. |
Technical Writer for Technical Analysis of STOCKS & COMMODITIES magazine, Working-Money.com, and Traders.com Advantage.
| Title: | Technical Writer |
| Company: | Technical Analysis, Inc. |
| Address: | 4757 California Avenue SW |
| Seattle, WA 98116 | |
| Phone # for sales: | 206 938 0570 |
| Fax: | 206 938 1307 |
| Website: | www.Traders.com |
| E-mail address: | DPenn@traders.com |
Traders' Resource Links | |
| Charting the Stock Market: The Wyckoff Method -- Books | |
| Working-Money.com -- Online Trading Services | |
| Traders.com Advantage -- Online Trading Services | |
| Technical Analysis of Stocks & Commodities -- Publications and Newsletters | |
| Working Money, at Working-Money.com -- Publications and Newsletters | |
| Traders.com Advantage -- Publications and Newsletters | |
| Professional Traders Starter Kit -- Software | |
Click here for more information about our publications!
Comments

Request Information From Our Sponsors
- StockCharts.com, Inc.
- Candle Patterns
- Candlestick Charting Explained
- Intermarket Technical Analysis
- John Murphy on Chart Analysis
- John Murphy's Chart Pattern Recognition
- John Murphy's Market Message
- MurphyExplainsMarketAnalysis-Intermarket Analysis
- MurphyExplainsMarketAnalysis-Visual Analysis
- StockCharts.com
- Technical Analysis of the Financial Markets
- The Visual Investor
- VectorVest, Inc.
- Executive Premier Workshop
- One-Day Options Course
- OptionsPro
- Retirement Income Workshop
- Sure-Fire Trading Systems (VectorVest, Inc.)
- Trading as a Business Workshop
- VectorVest 7 EOD
- VectorVest 7 RealTime/IntraDay
- VectorVest AutoTester
- VectorVest Educational Services
- VectorVest OnLine
- VectorVest Options Analyzer
- VectorVest ProGraphics v6.0
- VectorVest ProTrader 7
- VectorVest RealTime Derby Tool
- VectorVest Simulator
- VectorVest Variator
- VectorVest Watchdog