HOT TOPICS LIST
- MACD
- Fibonacci
- RSI
- Gann
- ADXR
- Stochastics
- Volume
- Triangles
- Futures
- Cycles
- Volatility
- ZIGZAG
- MESA
- Retracement
- Aroon
INDICATORS LIST
LIST OF TOPICS
PRINT THIS ARTICLE
by David Penn
Has the great REIT rally finally run out of upside?
Position: N/A
David Penn
Technical Writer for Technical Analysis of STOCKS & COMMODITIES magazine, Working-Money.com, and Traders.com Advantage.
PRINT THIS ARTICLE
HEAD & SHOULDERS
A Head & Shoulders Top In REITs
05/30/07 08:47:52 AMby David Penn
Has the great REIT rally finally run out of upside?
Position: N/A
| For weeks in 2005 I would get email announcements from NAREIT, the National Association of Real Estate Investment Trusts. Like most email announcements from such entities, these messages were ecstatic about the prospects for their industry. I had written a little about real estate investment trusts way back in 2001 and thought they were an underrated sector that deserved more attention from retail investors. Email after email would arrive, making me think, "You know, I really ought to follow up with those NAREIT guys ..." But one thing or another would always come up to redirect my attention. So now it figures that just when the incredible REIT rally appears to be running out of steam that I would miraculously "find time" to talk about the group. Shame on me. |

|
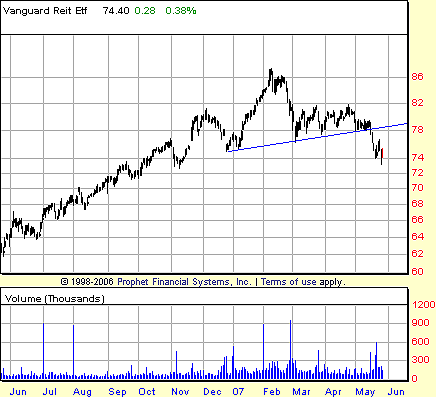
| FIGURE 1: VANGUARD REIT EXCHANGE TRADED FUND (VNQ), DAILY. REITs peaked in February 2007, but the head & shoulders top currently hinting at a significant reversal has its origins in the autumn of 2006. The formation projects a target low near 66. |
| Graphic provided by: Prophet Financial, Inc. |
| |
| But what can you do when you are doing recon through the sectors and stumble upon a topping pattern like the one in Figure 1? The consolidation in Figure 1 is a head & shoulders top, one of the most common reversal chart patterns. The head & shoulders top consists of three distinct peaks: two outer peaks (shoulders) and a center peak (the head) that is larger than the other two. The neckline, a relatively horizontal line that connects the trough lows between the two outer peaks, is the source of critical support for the head & shoulders top. When the neckline is broken to the downside, prices in a head & shoulders top tend to move as far downward from the neckline as the formation was tall. A head & shoulders top that measures 10 points will likely see the market fall 10 points down from the neckline in an initial downside break. |

|
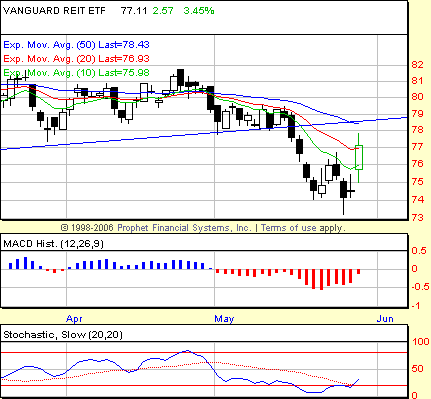
| FIGURE 2: VANGUARD REIT EXCHANGE TRADED FUND (VNQ), DAILY. The same REIT ETF through the lens of the moving average trio, MACD histogram, and BOSO stochastic is bearish on all counts. The short-term (five day) positive divergence in late May helped bounce the ETF higher, but resistance looms at the 78 level. |
| Graphic provided by: Prophet Financial, Inc. |
| |
| As with many patterns, speculators need to be wary of pullbacks to the break level. While these pullbacks are most often resolved by the market reversing again to complete the break and reach the minimum projected target, they can serve as shocks to the system if the trader is not prepared for them. This means traders who are not careful can panic themselves out of a winning position by buying a pullback in a head & shoulders top breakdown, only to see prices meet resistance at the neckline (a typical and quite common case of support becoming resistance once broken), reverse, and move downward again. |
| Figure 2 shows the Vanguard REIT exchange traded fund (ETF) against my current favorite set of technical indicators: the moving average trio (see my Working-Money.com article, "Moving Average Trios," May 25, 2007), the moving average convergence/divergence (MACD) histogram (see my two-part, Working-Money.com article, "Trading The MACD Histogram," December 6 and 9, 2006), and the BOSO stochastic (see my article "BOSO" from the October 5, 2005, issue of Working-Money.com). And per these indicators, the REITS are still under significant pressure. |
| There was a bearish realignment in the VNQ on May 1 that was confirmed as of the close on May 15 at 77.60. The most recent confirmed MACD histogram signal was a bearish p-P-p pattern that ended on May 15 and was confirmed as of the close on May 16 at 76.64. This time around, the late signal came from the BOSO. VNQ went oversold on May 16 and was confirmed on a follow-through lower close on May 17 at 75.31. VNQ fell to a closing low of 74.12 on May 24 and has since bounced sharply. If you look carefully, you can even see a short-term (for example, five-day) positive divergence in both the MACD histogram and the stochastic that telegraphed the bounce. The question now is whether or not this bounce — which finds the VNQ hurtling toward potential resistance in the form of the 50-day exponential moving average and the neckline of the head & shoulders top — will scare enough traders who are reasonably short to become unreasonably long. |
Technical Writer for Technical Analysis of STOCKS & COMMODITIES magazine, Working-Money.com, and Traders.com Advantage.
| Title: | Technical Writer |
| Company: | Technical Analysis, Inc. |
| Address: | 4757 California Avenue SW |
| Seattle, WA 98116 | |
| Phone # for sales: | 206 938 0570 |
| Fax: | 206 938 1307 |
| Website: | www.Traders.com |
| E-mail address: | DPenn@traders.com |
Traders' Resource Links | |
| Charting the Stock Market: The Wyckoff Method -- Books | |
| Working-Money.com -- Online Trading Services | |
| Traders.com Advantage -- Online Trading Services | |
| Technical Analysis of Stocks & Commodities -- Publications and Newsletters | |
| Working Money, at Working-Money.com -- Publications and Newsletters | |
| Traders.com Advantage -- Publications and Newsletters | |
| Professional Traders Starter Kit -- Software | |
Click here for more information about our publications!
PRINT THIS ARTICLE

Request Information From Our Sponsors
- StockCharts.com, Inc.
- Candle Patterns
- Candlestick Charting Explained
- Intermarket Technical Analysis
- John Murphy on Chart Analysis
- John Murphy's Chart Pattern Recognition
- John Murphy's Market Message
- MurphyExplainsMarketAnalysis-Intermarket Analysis
- MurphyExplainsMarketAnalysis-Visual Analysis
- StockCharts.com
- Technical Analysis of the Financial Markets
- The Visual Investor
- VectorVest, Inc.
- Executive Premier Workshop
- One-Day Options Course
- OptionsPro
- Retirement Income Workshop
- Sure-Fire Trading Systems (VectorVest, Inc.)
- Trading as a Business Workshop
- VectorVest 7 EOD
- VectorVest 7 RealTime/IntraDay
- VectorVest AutoTester
- VectorVest Educational Services
- VectorVest OnLine
- VectorVest Options Analyzer
- VectorVest ProGraphics v6.0
- VectorVest ProTrader 7
- VectorVest RealTime Derby Tool
- VectorVest Simulator
- VectorVest Variator
- VectorVest Watchdog
