HOT TOPICS LIST
- MACD
- Fibonacci
- RSI
- Gann
- ADXR
- Stochastics
- Volume
- Triangles
- Futures
- Cycles
- Volatility
- ZIGZAG
- MESA
- Retracement
- Aroon
INDICATORS LIST
LIST OF TOPICS
PRINT THIS ARTICLE
by Gary Grosschadl
This Dow Jones index is in a breakout pattern. So what is the upside target?
Position: Buy
Gary Grosschadl
Independent Canadian equities trader and technical analyst based in Peterborough
Ontario, Canada.
PRINT THIS ARTICLE
ASCENDING TRIANGLES
US Paper Index Beats Rock And Scissors
05/31/07 08:50:11 AMby Gary Grosschadl
This Dow Jones index is in a breakout pattern. So what is the upside target?
Position: Buy
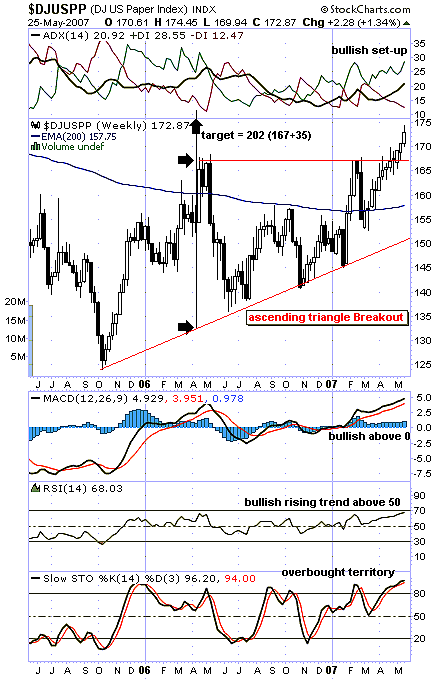
| Figure 1, this weekly chart, shows the Dow Jones US Paper Index in a breakout formation via an ascending triangle breakout. The ascending triangle is a bullish formation that usually forms during an uptrend as a continuation pattern and suggests accumulation. |
| Several technical indicators are worthy of comment. At the top of the chart, the three components of the directional movment indicator show a bullish setup. A rising average directional movement index (ADX) line above 20, in between bullishly poised DI lines (positive and negative directional indexes), shows a strong and rising trend. Below the chart, the moving average convergence/divergence (MACD) and the relative strength index (RSI) show bullish rising trends. Meanwhile, the stochastic oscillator is in overbought territory, which is a cautionary note. However, when a strong trend is in place, this indicator can "stick high" for a period of time. |

|
| FIGURE 1: DOW JONES US PAPER INDEX, WEEKLY. A breakout is showing in this index. |
| Graphic provided by: StockCharts.com. |
| |
| The upside target for this triangle break is 202, which is the measurement of the widest part of the triangle, applied to the move above the upper trendline (breakout point). This is a guideline only as the move can fall short or be exceeded, depending on emotional drivers behind market perceptions. |
| With this index showing a bullish development, traders may want to target bullish-looking stock plays in this sector. |
Independent Canadian equities trader and technical analyst based in Peterborough
Ontario, Canada.
| Website: | www.whatsonsale.ca/financial.html |
| E-mail address: | gwg7@sympatico.ca |
Click here for more information about our publications!
PRINT THIS ARTICLE

Request Information From Our Sponsors
- StockCharts.com, Inc.
- Candle Patterns
- Candlestick Charting Explained
- Intermarket Technical Analysis
- John Murphy on Chart Analysis
- John Murphy's Chart Pattern Recognition
- John Murphy's Market Message
- MurphyExplainsMarketAnalysis-Intermarket Analysis
- MurphyExplainsMarketAnalysis-Visual Analysis
- StockCharts.com
- Technical Analysis of the Financial Markets
- The Visual Investor
- VectorVest, Inc.
- Executive Premier Workshop
- One-Day Options Course
- OptionsPro
- Retirement Income Workshop
- Sure-Fire Trading Systems (VectorVest, Inc.)
- Trading as a Business Workshop
- VectorVest 7 EOD
- VectorVest 7 RealTime/IntraDay
- VectorVest AutoTester
- VectorVest Educational Services
- VectorVest OnLine
- VectorVest Options Analyzer
- VectorVest ProGraphics v6.0
- VectorVest ProTrader 7
- VectorVest RealTime Derby Tool
- VectorVest Simulator
- VectorVest Variator
- VectorVest Watchdog
