HOT TOPICS LIST
- MACD
- Fibonacci
- RSI
- Gann
- ADXR
- Stochastics
- Volume
- Triangles
- Futures
- Cycles
- Volatility
- ZIGZAG
- MESA
- Retracement
- Aroon
INDICATORS LIST
LIST OF TOPICS
PRINT THIS ARTICLE
by Gary Grosschadl
Has a bottom finally shown up to produce a tradable bounce?
Position: Accumulate
Gary Grosschadl
Independent Canadian equities trader and technical analyst based in Peterborough
Ontario, Canada.
PRINT THIS ARTICLE
CHART ANALYSIS
Tuning In To XM Satellite Radio
05/31/07 08:42:35 AMby Gary Grosschadl
Has a bottom finally shown up to produce a tradable bounce?
Position: Accumulate
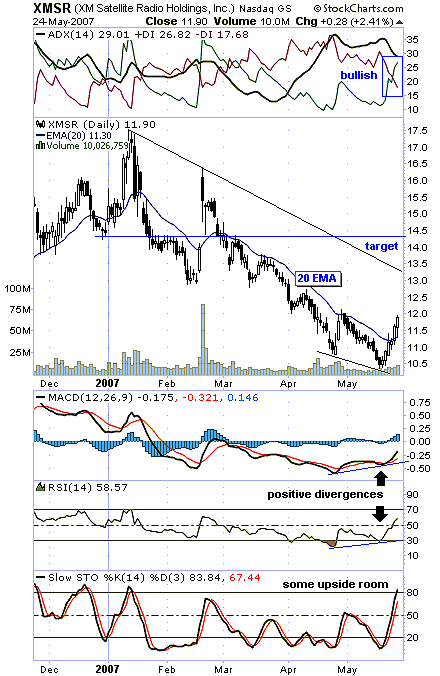
| The year 2007 has not been kind to this stock, since XM Satellite Radio (XMSR) has declined from $17.50 to near $10. There are several hints that a tradable bounce may be occurring, however (Figure 1). |
| The first hint is a move above the often telling 20-day moving average (in this case, the exponential moving average). I refer to stocks in a decline that stay under this moving average as being in "failure mode" — bear rallies that fail at this overhead resistance. For the first time in several months, this stock has finally closed above the 20-day EMA. This points to a possible bounce beyond its typical bear rallies of late. |

|
| FIGURE 1: XMSR, DAILY. This chart suggests a bottom bounce. |
| Graphic provided by: StockCharts.com. |
| |
| As always, it is wise to look for collaborative evidence or signs. At the top of the chart, we see that there is a bullish crossing of the directional movement indicators (DIs). This points to a shift to bullish power (the green +DI). Below the chart, there is evidence of positive divergences via the moving average convergence/divergence indicator (MACD) and the relative strength index (RSI). When a stock makes new lows but indicators instead go the other way, a bounce is often in the works. Early action shows this to be the case. The stochastic indicator shows some upside room but is getting into an overbought area. |
| An upside target zone is shown by virtue of a trendline near $13.25 and an area of previous support and resistance near $14.25. The stock may have to first consolidate a little before hitting this target area, but the 20-day EMA must hold; otherwise, a potential double bottom could develop, meaning another bottoming downleg. Stay tuned to XMSR Satellite Radio for a clearer emerging signal. |
Independent Canadian equities trader and technical analyst based in Peterborough
Ontario, Canada.
| Website: | www.whatsonsale.ca/financial.html |
| E-mail address: | gwg7@sympatico.ca |
Click here for more information about our publications!
PRINT THIS ARTICLE

Request Information From Our Sponsors
- StockCharts.com, Inc.
- Candle Patterns
- Candlestick Charting Explained
- Intermarket Technical Analysis
- John Murphy on Chart Analysis
- John Murphy's Chart Pattern Recognition
- John Murphy's Market Message
- MurphyExplainsMarketAnalysis-Intermarket Analysis
- MurphyExplainsMarketAnalysis-Visual Analysis
- StockCharts.com
- Technical Analysis of the Financial Markets
- The Visual Investor
- VectorVest, Inc.
- Executive Premier Workshop
- One-Day Options Course
- OptionsPro
- Retirement Income Workshop
- Sure-Fire Trading Systems (VectorVest, Inc.)
- Trading as a Business Workshop
- VectorVest 7 EOD
- VectorVest 7 RealTime/IntraDay
- VectorVest AutoTester
- VectorVest Educational Services
- VectorVest OnLine
- VectorVest Options Analyzer
- VectorVest ProGraphics v6.0
- VectorVest ProTrader 7
- VectorVest RealTime Derby Tool
- VectorVest Simulator
- VectorVest Variator
- VectorVest Watchdog
