HOT TOPICS LIST
- MACD
- Fibonacci
- RSI
- Gann
- ADXR
- Stochastics
- Volume
- Triangles
- Futures
- Cycles
- Volatility
- ZIGZAG
- MESA
- Retracement
- Aroon
INDICATORS LIST
LIST OF TOPICS
PRINT THIS ARTICLE
by Koos van der Merwe
Everyone's talking about a bubble, whether there's one ready to burst or there's one expanding.
Position: N/A
Koos van der Merwe
Has been a technical analyst since 1969, and has worked as a futures and options trader with First Financial Futures in Johannesburg, South Africa.
PRINT THIS ARTICLE
TECHNICAL INDICATORS
Blowing Bubbles
05/30/07 10:32:19 AMby Koos van der Merwe
Everyone's talking about a bubble, whether there's one ready to burst or there's one expanding.
Position: N/A
| "I'm Forever Blowing Bubbles" was a popular song that debuted in 1918, with the tune by John Kellette and lyrics by Jaan Kenbrovin. Today, the song is the club anthem of a London-based football club, the West Ham United: "They fly so high, nearly reach the sky, Then like my dreams, they fade and die. Fortune's always hiding, I've looked everywhere, I'm forever blowing bubbles, pretty bubbles in the air." |
| Should we start singing this song as the Dow industrials and the Standard & Poor's move higher? Everyone is talking about a "bubble," whether it is one ready to burst on the Shanghai stock market or one expanding on the US market. Speculation is rife. So do you ride with the tide, or do you start selling into the bubble and protect your assets, leaving the speculation to the Las Vegas gambler? That's a difficult decision. What do the charts tell me? |

|
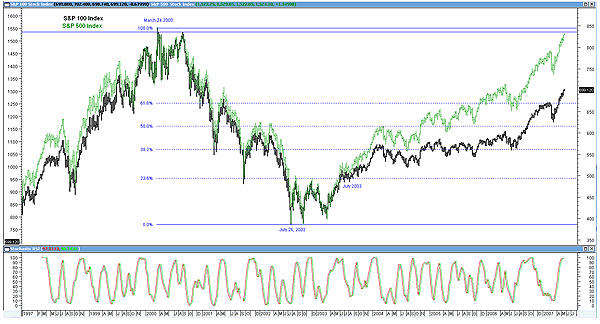
| FIGURE 1: SPX VS. OEX. Is it a bubble or not? The SPX here is compared to the OEX. |
| Graphic provided by: MetaStock. |
| |
| Figure 1 is a weekly chart of the S&P 100 and S&P 500. The S&P 100 is unlike the Dow Jones Industrial Average (DJIA), and the S&P 500 is like the NASDAQ, in not making new highs. The S&P 100 is a subset of the S&P 500, tracking the largest and most liquid stocks that have option contracts traded on them. The index measures large US stock market performance. Note how the S&P 500 (SPX) is close to breaking the high reached by both Indexes on March 24, 2000. Then from that date, it fell to the low on July 26, 2002. From this point, both indexes started moving up in tandem, but then from July 2003 the SPX started moving up strongly while the OEX lagged behind. Is this telling us something? I believe that it is telling us that large-cap stocks are not attracting as much speculative investment as the small caps are. Speculators are seeing better growth and returns in smaller companies than in the larger, well-known companies. |
| My indicator is the stochastic relative strength index (RSI). It is suggesting an overbought position and could well be signaling the start of a correction to any one of the Fibonacci levels shown. Whether this is a pause in the inexorable bull market or the start of a C-wave down and the bursting of the bubble, only time will tell. A contrarian could well argue that with "bubble" on everyone's lips, any correction is a buying opportunity. And so we wait and watch and enjoy the rainbow of "pretty bubbles in the air." |
Has been a technical analyst since 1969, and has worked as a futures and options trader with First Financial Futures in Johannesburg, South Africa.
| Address: | 3256 West 24th Ave |
| Vancouver, BC | |
| Phone # for sales: | 6042634214 |
| E-mail address: | petroosp@gmail.com |
Click here for more information about our publications!
PRINT THIS ARTICLE

Request Information From Our Sponsors
- StockCharts.com, Inc.
- Candle Patterns
- Candlestick Charting Explained
- Intermarket Technical Analysis
- John Murphy on Chart Analysis
- John Murphy's Chart Pattern Recognition
- John Murphy's Market Message
- MurphyExplainsMarketAnalysis-Intermarket Analysis
- MurphyExplainsMarketAnalysis-Visual Analysis
- StockCharts.com
- Technical Analysis of the Financial Markets
- The Visual Investor
- VectorVest, Inc.
- Executive Premier Workshop
- One-Day Options Course
- OptionsPro
- Retirement Income Workshop
- Sure-Fire Trading Systems (VectorVest, Inc.)
- Trading as a Business Workshop
- VectorVest 7 EOD
- VectorVest 7 RealTime/IntraDay
- VectorVest AutoTester
- VectorVest Educational Services
- VectorVest OnLine
- VectorVest Options Analyzer
- VectorVest ProGraphics v6.0
- VectorVest ProTrader 7
- VectorVest RealTime Derby Tool
- VectorVest Simulator
- VectorVest Variator
- VectorVest Watchdog
