HOT TOPICS LIST
- MACD
- Fibonacci
- RSI
- Gann
- ADXR
- Stochastics
- Volume
- Triangles
- Futures
- Cycles
- Volatility
- ZIGZAG
- MESA
- Retracement
- Aroon
INDICATORS LIST
LIST OF TOPICS
PRINT THIS ARTICLE
by Gary Grosschadl
The high-tech index looks vulnerable here. A downturn would not be a surprise, but what are the targets?
Position: Sell
Gary Grosschadl
Independent Canadian equities trader and technical analyst based in Peterborough
Ontario, Canada.
PRINT THIS ARTICLE
CANDLESTICK CHARTING
Candlestick Warning For The NASDAQ Composite
05/30/07 10:17:59 AMby Gary Grosschadl
The high-tech index looks vulnerable here. A downturn would not be a surprise, but what are the targets?
Position: Sell
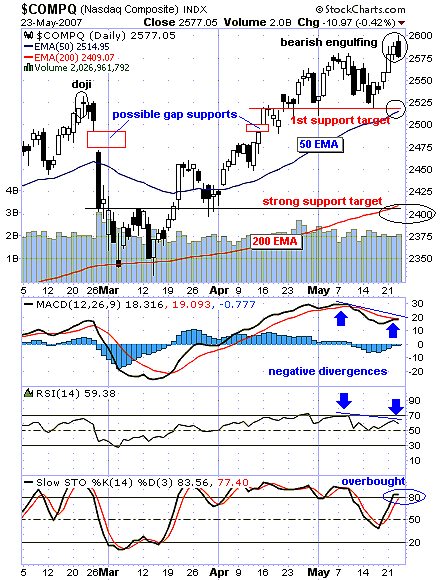
| After rising near 300 points from a bounce of its 200-day exponential moving average (EMA), a candlestick warning hits the NASDAQ. A bearish engulfing candlestick pattern can be a strong reversal signal after a strong rise, and this is the current view on this daily chart (Figure 1). Note the last downturn was preceded by a doji candlestick from late February 2007, another top warning. |
| There are several indicators agreeing with this bearish candlestick outlook. I always look for multiple negative divergences when eyeing any possible swing from a high or low point on a chart. Both the moving average convergence/divergence (MACD) and the relative strength index (RSI) show a move lower while the NASDAQ popped higher. When indicators fail to confirm a new high (or low), the move is often suspect. The stochastic oscillator shows a slightly overbought condition, so a downturn from here would not be a surprise. Previously, this indicator stayed overbought (stuck high) for an extended time, but this was when there was a strong and rising trend via the previously mentioned indicators. |

|
| FIGURE 1: NASDAQ. A bearish engulfing pattern warns of a possible top. |
| Graphic provided by: StockCharts.com. |
| |
| Should a downturn ensue, several targets are possible. The first nearby possible support is in the vicinity of the 50-day EMA, currently 2515. This level also relates to a previous support level. A pause or temporary support here is more conceivable than a bounce, but the market will decide soon enough. Stronger support lies once again at the 200-day EMA, currently 2409. This level also relates to the previous support and the bottom of a very large black candlestick. In addition, near the 2500 level, there are two previous gaps. Gaps can also act as areas of support. |
| Exactly where possible support kicks in remains to be seen, but these are the areas I am eyeing. As always, the market will have the final say. |
Independent Canadian equities trader and technical analyst based in Peterborough
Ontario, Canada.
| Website: | www.whatsonsale.ca/financial.html |
| E-mail address: | gwg7@sympatico.ca |
Click here for more information about our publications!
PRINT THIS ARTICLE

Request Information From Our Sponsors
- StockCharts.com, Inc.
- Candle Patterns
- Candlestick Charting Explained
- Intermarket Technical Analysis
- John Murphy on Chart Analysis
- John Murphy's Chart Pattern Recognition
- John Murphy's Market Message
- MurphyExplainsMarketAnalysis-Intermarket Analysis
- MurphyExplainsMarketAnalysis-Visual Analysis
- StockCharts.com
- Technical Analysis of the Financial Markets
- The Visual Investor
- VectorVest, Inc.
- Executive Premier Workshop
- One-Day Options Course
- OptionsPro
- Retirement Income Workshop
- Sure-Fire Trading Systems (VectorVest, Inc.)
- Trading as a Business Workshop
- VectorVest 7 EOD
- VectorVest 7 RealTime/IntraDay
- VectorVest AutoTester
- VectorVest Educational Services
- VectorVest OnLine
- VectorVest Options Analyzer
- VectorVest ProGraphics v6.0
- VectorVest ProTrader 7
- VectorVest RealTime Derby Tool
- VectorVest Simulator
- VectorVest Variator
- VectorVest Watchdog
