HOT TOPICS LIST
- MACD
- Fibonacci
- RSI
- Gann
- ADXR
- Stochastics
- Volume
- Triangles
- Futures
- Cycles
- Volatility
- ZIGZAG
- MESA
- Retracement
- Aroon
INDICATORS LIST
LIST OF TOPICS
PRINT THIS ARTICLE
by Austin Passamonte
Measuring support and resistance zones via Fibonacci and retracement tools.
Position: N/A
Austin Passamonte
Austin is a private trader who trades emini stock index futures intraday. He currently trades various futures markets from home in addition to managing a trader's educational forum
PRINT THIS ARTICLE
FIBONACCI
S&P Seeking Support
05/30/07 09:38:27 AMby Austin Passamonte
Measuring support and resistance zones via Fibonacci and retracement tools.
Position: N/A
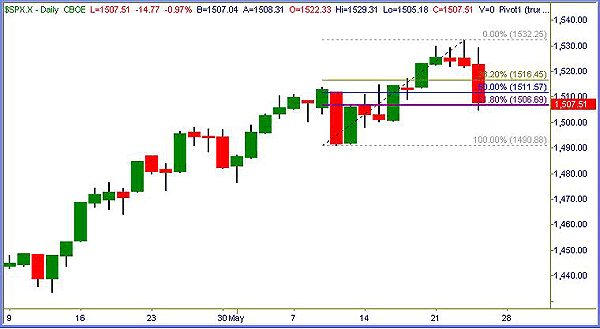
| Following a sharp selloff on February 27 this year, the Standard & Poor's 500 led all indexes upward in a seemingly straight ascent. That rise brought price action in the cash market to a handful of points from a new record high on the close. Three successive attempts this week failed to make that mark as price action narrowed and the ascent tapered off. |

|
| FIGURE 1: S&P 500 FUTURES (ES), DAILY |
| Graphic provided by: TradeStation. |
| |
| With one fell swoop of the seller's program buttons, 14 previous sessions' worth of rally was erased between the opening and closing bells. Count backward that many daily candles/bars in Figure 1 and we see where price action on May 14 closed right near today's ending value. What goes up in fits and starts, leaving low-volume air pockets below, usually corrects itself in far more rapid fashion. We've seen it before many times, and another example can be seen here for us today. |
| Countless thousands of S&P traders are watching and reacting to this spot on the chart. Volume of buy-stops and sell-stops clustered nearby are already forming. A quick bounce back up above 1517 and the new-closing high watch can resume. A break below 1506 brings 1500, 1490, and 1475 zones back into play. |
| Summertime trading is often said to be dull. It's quite possible we can expect anything but that to grace our charts in 2007. One brief glance at the charts of summer 2002 will show that the summer market and low volatility are not always synonymous. |
Austin is a private trader who trades emini stock index futures intraday. He currently trades various futures markets from home in addition to managing a trader's educational forum
| Title: | Individual Trader |
| Company: | CoiledMarkets.com |
| Address: | PO Box 633 |
| Naples, NY 14512 | |
| Website: | coiledmarkets.com/blog |
| E-mail address: | austinp44@yahoo.com |
Traders' Resource Links | |
| CoiledMarkets.com has not added any product or service information to TRADERS' RESOURCE. | |
Click here for more information about our publications!
PRINT THIS ARTICLE

Request Information From Our Sponsors
- StockCharts.com, Inc.
- Candle Patterns
- Candlestick Charting Explained
- Intermarket Technical Analysis
- John Murphy on Chart Analysis
- John Murphy's Chart Pattern Recognition
- John Murphy's Market Message
- MurphyExplainsMarketAnalysis-Intermarket Analysis
- MurphyExplainsMarketAnalysis-Visual Analysis
- StockCharts.com
- Technical Analysis of the Financial Markets
- The Visual Investor
- VectorVest, Inc.
- Executive Premier Workshop
- One-Day Options Course
- OptionsPro
- Retirement Income Workshop
- Sure-Fire Trading Systems (VectorVest, Inc.)
- Trading as a Business Workshop
- VectorVest 7 EOD
- VectorVest 7 RealTime/IntraDay
- VectorVest AutoTester
- VectorVest Educational Services
- VectorVest OnLine
- VectorVest Options Analyzer
- VectorVest ProGraphics v6.0
- VectorVest ProTrader 7
- VectorVest RealTime Derby Tool
- VectorVest Simulator
- VectorVest Variator
- VectorVest Watchdog
