HOT TOPICS LIST
- MACD
- Fibonacci
- RSI
- Gann
- ADXR
- Stochastics
- Volume
- Triangles
- Futures
- Cycles
- Volatility
- ZIGZAG
- MESA
- Retracement
- Aroon
INDICATORS LIST
LIST OF TOPICS
PRINT THIS ARTICLE
by Austin Passamonte
An expanding wedge coupled with a narrow-range channel spelled imminent action for the S&P.
Position: N/A
Austin Passamonte
Austin is a private trader who trades emini stock index futures intraday. He currently trades various futures markets from home in addition to managing a trader's educational forum
PRINT THIS ARTICLE
BROADENING FORMATION
Ranged Break
05/30/07 09:27:00 AMby Austin Passamonte
An expanding wedge coupled with a narrow-range channel spelled imminent action for the S&P.
Position: N/A
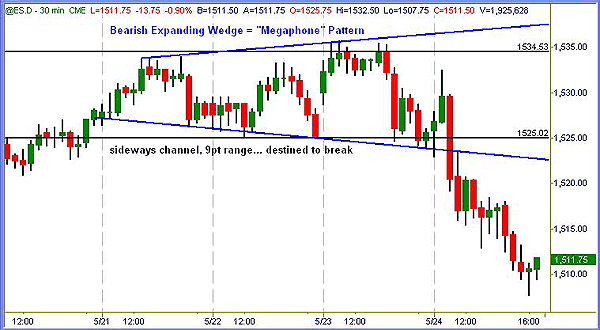
| Heading into a holiday weekend is usually light volume, bullish market action. The Standard & Poor's 500 shot up above its all-time closing high each day this week, only to close slightly below at the end. It seemed to be a given that big-money players would hold that historical print past the close. See Figure 1. |

|
| FIGURE 1: S&P 500 EMINI FUTURES (ES) |
| Graphic provided by: TradeStation. |
| |
| Logic and reason have little to do with financial market action in general, trading in particular. Thankfully, we have technical analysis to measure our way through pending price action. |
| From Monday through Wednesday, the S&P 500 (emini futures shown) held within a sideways range of less than 10 index points. That type of comatose market (in)action simply cannot last. When it breaks, the directional burst is usually substantial. |
| In the process of channeling sideways, the index also formed an expanding wedge pattern, which is bearish. Instead of coiling into a consolidation pattern of stored energy, an expanding wedge is literally expending energy. When the pattern breaks, it is usually downside. |
| A bearish overall price pattern coupled with small-range, sideways price action had stock indexes poised for a directional push. Once it broke, sell signals from 1525 down to 1515 offered numerous intraday short trades in succession. The S&P has a habit of forming multisession, constricted sideways channels just like this. We'll see the same general setup again down the road and will trade it accordingly. |
Austin is a private trader who trades emini stock index futures intraday. He currently trades various futures markets from home in addition to managing a trader's educational forum
| Title: | Individual Trader |
| Company: | CoiledMarkets.com |
| Address: | PO Box 633 |
| Naples, NY 14512 | |
| Website: | coiledmarkets.com/blog |
| E-mail address: | austinp44@yahoo.com |
Traders' Resource Links | |
| CoiledMarkets.com has not added any product or service information to TRADERS' RESOURCE. | |
Click here for more information about our publications!
PRINT THIS ARTICLE

Request Information From Our Sponsors
- StockCharts.com, Inc.
- Candle Patterns
- Candlestick Charting Explained
- Intermarket Technical Analysis
- John Murphy on Chart Analysis
- John Murphy's Chart Pattern Recognition
- John Murphy's Market Message
- MurphyExplainsMarketAnalysis-Intermarket Analysis
- MurphyExplainsMarketAnalysis-Visual Analysis
- StockCharts.com
- Technical Analysis of the Financial Markets
- The Visual Investor
- VectorVest, Inc.
- Executive Premier Workshop
- One-Day Options Course
- OptionsPro
- Retirement Income Workshop
- Sure-Fire Trading Systems (VectorVest, Inc.)
- Trading as a Business Workshop
- VectorVest 7 EOD
- VectorVest 7 RealTime/IntraDay
- VectorVest AutoTester
- VectorVest Educational Services
- VectorVest OnLine
- VectorVest Options Analyzer
- VectorVest ProGraphics v6.0
- VectorVest ProTrader 7
- VectorVest RealTime Derby Tool
- VectorVest Simulator
- VectorVest Variator
- VectorVest Watchdog
