HOT TOPICS LIST
- MACD
- Fibonacci
- RSI
- Gann
- ADXR
- Stochastics
- Volume
- Triangles
- Futures
- Cycles
- Volatility
- ZIGZAG
- MESA
- Retracement
- Aroon
INDICATORS LIST
LIST OF TOPICS
PRINT THIS ARTICLE
by David Penn
Positive divergences and a stochastic pop lead lumber higher in May.
Position: N/A
David Penn
Technical Writer for Technical Analysis of STOCKS & COMMODITIES magazine, Working-Money.com, and Traders.com Advantage.
PRINT THIS ARTICLE
REVERSAL
A Lift In Lumber
05/24/07 09:12:46 AMby David Penn
Positive divergences and a stochastic pop lead lumber higher in May.
Position: N/A
| One of my favorite momentum setups of late combines divergences in the moving average convergence/divergence (MACD) histogram, new extremes in the stochastic, and a bullish realignment of short-, intermediate-, and longer-term moving averages. This spring, I wrote about the effectiveness of combining divergences and extreme stochastics in an article for Traders.com Advantage ("BOSO And The S&P 500 Breakout," April 20, 2007). In that article I pointed out how a positive divergence signaled an end to the sharp and surprising correction in March, and how an overbought stochastic served notice that the bounce higher was for real. |
| What is especially helpful with the BOSO approach (see my Working-Money article, "BOSO," from October 5, 2005, for a more detailed discussion on trading overbought and oversold stochastics) is that it will often keep traders in a trade even when prices correct. In the case of the Standard & Poor's 500, this helped traders stay long the S&P in late March as the market began to move lower in the wake of the bounce from the positive divergence. I haven't written about the lumber market in over a year. My last Traders.com Advantage article on that market, "Bears Lay Wood To Lumber," discussed the decline in lumber futures at the beginning of 2006. The point of that article, in part, was to caution traders that the worst was likely not yet over. The point of this article — more than a year later — is to suggest that it might be time for the lumber bulls to take the lumber bears to the woodshed. See Figure 1. |

|
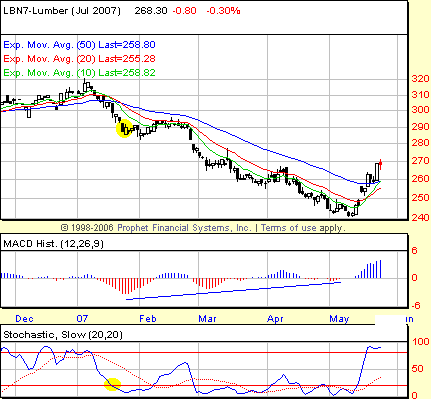
| FIGURE 1: LUMBER, JULY FUTURES, DAILY. The four and a half month bear market in lumber futures is seen here. Short entries based on a bearish realignment of the moving averages and on the oversold stochastic are highlighted in the price chart. |
| Graphic provided by: Prophet Financial, Inc. |
| |
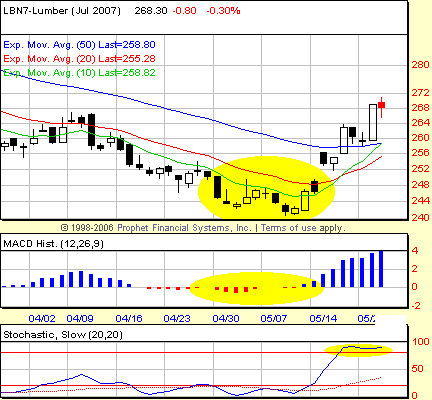
| Why so? Many of the same technical developments I saw in the S&P 500 earlier this year are present in the chart of the July 2007 lumber futures contract. The multimonth divergences — from the trough in late January to the trough in early March to the shallow trough in early May — provide the clue that a bottom is in the making (July lumber fell from more than $290 to less than $250 from late January to early May). The bearishness of July lumber during this period was also underscored by the oversold stochastic. The lift in lumber — which is helping make the difference between a market that is no longer going down and a market that is actually going up — was signaled by three different technical indicators. Consider first the size of the MACD histogram peak as July lumber moved higher in May. When histogram peaks of this size — an all-time high for the contract — develop after a positive divergence, they often provide a powerful signal that higher prices are ahead. Those higher prices may be preceded by a correction. But the price high that accompanies the MACD histogram peak remains likely to be exceeded. See Figure 2. |

|
| FIGURE 2: LUMBER, JULY FUTURES, DAILY. A confluence of technical signals — from positive divergences in both the MACD histogram and the stochastic to a “stochastic pop” or BOSO breakout — point to higher prices for lumber as summer begins. |
| Graphic provided by: Prophet Financial, Inc. |
| |
| A second consideration is the newly overbought stochastic. With the stochastic becoming overbought and the market continuing to move higher, there is now a confirmed BOSO play to the upside. While there may be a pullback, there are two things traders should keep in mind: the positive divergence that supports the bottom and the fact that as long as the stochastic remains overbought, the market cannot significantly correct. |
| A third factor has not yet fully developed but is very much worth watching. That factor is the potential bullish realignment of the three exponential moving averages (EMAs): the 10-day, the 20-day, and the 50-day (see my forthcoming Working Money article "Moving Average Trios" for more on this technique). This bullish realignment will generate a bullish signal once the 10-day EMA is above the 20-day, and the 20-day is over the 50-day. Currently, the 10-day has crossed above the 20-day and is closing in on the 50-day. This suggests that while the BOSO — to say nothing of the positive divergence — has already provided bullish signals, there may be another bullish signal to come (and thus, no reason to rush in on the long side), courtesy of a bullish realignment of the moving averages. |
Technical Writer for Technical Analysis of STOCKS & COMMODITIES magazine, Working-Money.com, and Traders.com Advantage.
| Title: | Technical Writer |
| Company: | Technical Analysis, Inc. |
| Address: | 4757 California Avenue SW |
| Seattle, WA 98116 | |
| Phone # for sales: | 206 938 0570 |
| Fax: | 206 938 1307 |
| Website: | www.Traders.com |
| E-mail address: | DPenn@traders.com |
Traders' Resource Links | |
| Charting the Stock Market: The Wyckoff Method -- Books | |
| Working-Money.com -- Online Trading Services | |
| Traders.com Advantage -- Online Trading Services | |
| Technical Analysis of Stocks & Commodities -- Publications and Newsletters | |
| Working Money, at Working-Money.com -- Publications and Newsletters | |
| Traders.com Advantage -- Publications and Newsletters | |
| Professional Traders Starter Kit -- Software | |
Click here for more information about our publications!
Comments
Date: 05/24/07Rank: 3Comment:

Request Information From Our Sponsors
- StockCharts.com, Inc.
- Candle Patterns
- Candlestick Charting Explained
- Intermarket Technical Analysis
- John Murphy on Chart Analysis
- John Murphy's Chart Pattern Recognition
- John Murphy's Market Message
- MurphyExplainsMarketAnalysis-Intermarket Analysis
- MurphyExplainsMarketAnalysis-Visual Analysis
- StockCharts.com
- Technical Analysis of the Financial Markets
- The Visual Investor
- VectorVest, Inc.
- Executive Premier Workshop
- One-Day Options Course
- OptionsPro
- Retirement Income Workshop
- Sure-Fire Trading Systems (VectorVest, Inc.)
- Trading as a Business Workshop
- VectorVest 7 EOD
- VectorVest 7 RealTime/IntraDay
- VectorVest AutoTester
- VectorVest Educational Services
- VectorVest OnLine
- VectorVest Options Analyzer
- VectorVest ProGraphics v6.0
- VectorVest ProTrader 7
- VectorVest RealTime Derby Tool
- VectorVest Simulator
- VectorVest Variator
- VectorVest Watchdog
