HOT TOPICS LIST
- MACD
- Fibonacci
- RSI
- Gann
- ADXR
- Stochastics
- Volume
- Triangles
- Futures
- Cycles
- Volatility
- ZIGZAG
- MESA
- Retracement
- Aroon
INDICATORS LIST
LIST OF TOPICS
PRINT THIS ARTICLE
by Chaitali Mohile
Canadian Natural Resources made a double top at its highest level last year. Will it make a new high in its current period?
Position: N/A
Chaitali Mohile
Active trader in the Indian stock markets since 2003 and a full-time writer. Trading is largely based upon technical analysis.
PRINT THIS ARTICLE
DOUBLE TOPS
Can CNQ Make A New High?
06/05/07 02:15:50 PMby Chaitali Mohile
Canadian Natural Resources made a double top at its highest level last year. Will it make a new high in its current period?
Position: N/A
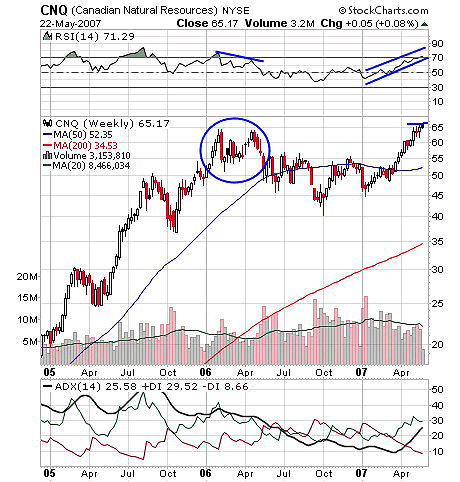
| Canadian Natural Resources (CNQ) formed a double top at $65 in February 2006 and May 2006, resulting in a consolidation. While consolidating, the stock's price faced the resistance of a 50-period moving average. The stock consolidated in the range of 45–55, so these 10 points attracted traders during consolidation. As a result, the stock faced equal pressure from both sides. Figure 1 shows in April 2007 the moving average resistance was crossed with heavy upper volume, giving birth to a bullish rally. The rally allowed many new traders from sound support at 50 till 65. So traders can see a cautious signal toward this rally. |
| In Figure 1, the relative strength index (RSI)(14) moved vertically from a 50 support level to 71. The overbought level at 71 indicates the possibility of a bullish rally ahead as the indicator has room to move ahead. But compared to last year, the RSI made lower highs above 70, finally settling by consolidating in the range of 50–70. So there is a possibility of consolidating as the RSI failed to sustain above 75. Average directional movement index (ADX)(14) at 25 indicates a developing uptrend with the ongoing bullish rally. |

|
| FIGURE 1: CNQ, WEEKLY. The double tops formed in 2006 gives a cautious signal for profit booking in the current week. |
| Graphic provided by: StockCharts.com. |
| |
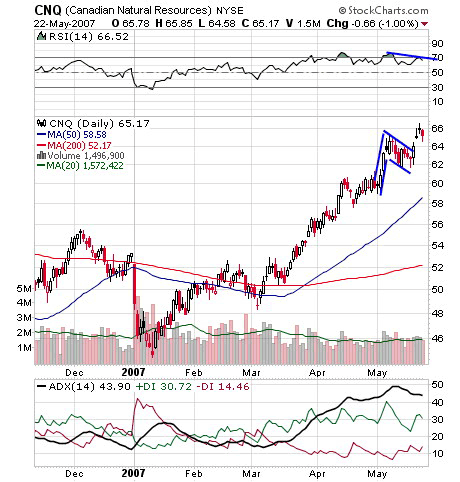
| Although the indicator does not give any alarming sell signal, to be safe, I would be keen on profit booking at current levels. There are high possibilities to make new highs with this rally as Figure 2 shows bullish strength but the moves can be judged but not predicted. |

|
| FIGURE 2: CNQ, DAILY. The failed flag & pennant breakout indicates the strong resistance of a previous high. |
| Graphic provided by: StockCharts.com. |
| |
| In Figure 2, CNQ has a failed flag & pennant breakout. Instead of moving toward the target, the breakout consolidated. Three candles on breakout do not give any clear indication. The lack of volume could be the reason for a failed breakout or the negative divergence by RSI (14). The RSI made lower highs while the price moved ahead, creating weakness. The average direcitonal movement index (ADX) (14) is marginally overheated above 40, adding more weakness for the breakout and resulting in sideways moves. Thus, prices failed to cross the 65 level. |
| Both charts advise for profit booking rather than holding with a stop-loss. The possibility of consolidation cannot be ruled out. I would suggest staying on the sidelines. |
Active trader in the Indian stock markets since 2003 and a full-time writer. Trading is largely based upon technical analysis.
| Company: | Independent |
| Address: | C1/3 Parth Indraprasth Towers. Vastrapur |
| Ahmedabad, Guj 380015 | |
| E-mail address: | chaitalimohile@yahoo.co.in |
Traders' Resource Links | |
| Independent has not added any product or service information to TRADERS' RESOURCE. | |
Click here for more information about our publications!
PRINT THIS ARTICLE

Request Information From Our Sponsors
- StockCharts.com, Inc.
- Candle Patterns
- Candlestick Charting Explained
- Intermarket Technical Analysis
- John Murphy on Chart Analysis
- John Murphy's Chart Pattern Recognition
- John Murphy's Market Message
- MurphyExplainsMarketAnalysis-Intermarket Analysis
- MurphyExplainsMarketAnalysis-Visual Analysis
- StockCharts.com
- Technical Analysis of the Financial Markets
- The Visual Investor
- VectorVest, Inc.
- Executive Premier Workshop
- One-Day Options Course
- OptionsPro
- Retirement Income Workshop
- Sure-Fire Trading Systems (VectorVest, Inc.)
- Trading as a Business Workshop
- VectorVest 7 EOD
- VectorVest 7 RealTime/IntraDay
- VectorVest AutoTester
- VectorVest Educational Services
- VectorVest OnLine
- VectorVest Options Analyzer
- VectorVest ProGraphics v6.0
- VectorVest ProTrader 7
- VectorVest RealTime Derby Tool
- VectorVest Simulator
- VectorVest Variator
- VectorVest Watchdog
