

HOT TOPICS LIST
- MACD
- Fibonacci
- RSI
- Gann
- ADXR
- Stochastics
- Volume
- Triangles
- Futures
- Cycles
- Volatility
- ZIGZAG
- MESA
- Retracement
- Aroon
INDICATORS LIST
LIST OF TOPICS
PRINT THIS ARTICLE
by Chaitali Mohile
By forming a bullish wedge, the biotechnology index gets ready to continue the bull run.
Position: Buy
Chaitali Mohile
Active trader in the Indian stock markets since 2003 and a full-time writer. Trading is largely based upon technical analysis.
PRINT THIS ARTICLE
WEDGE FORMATIONS
Biotechnology Index Completes Reaction Move
06/04/07 11:44:33 AMby Chaitali Mohile
By forming a bullish wedge, the biotechnology index gets ready to continue the bull run.
Position: Buy
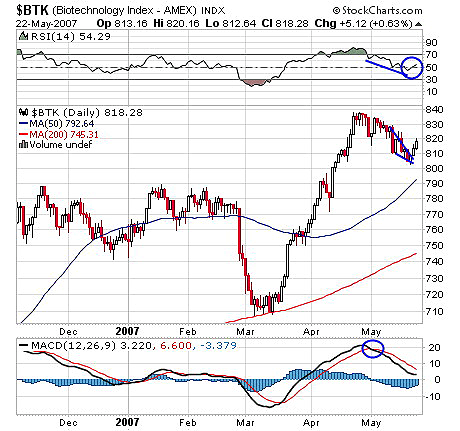
| The 200-day moving average offered support to a 120-point rally from 720 to 840. $BTK at 840 retested its all-time high but then lost around 40 points. The reaction began with range-bound consolidation initially, thereafter losing previous support. A bullish falling wedge is a bullish formation in an uptrend. The breakout from this formation restarts the bullish rally. In Figure 1, the biotechnology index has formed a bullish wedge during its reaction move. This shows that the reaction is complete and bulls may regain the rally. The index has broken out of a bullish wedge, moving 20 points from the breakout level. |
| The method to calculate the breakout level is by measuring the length of the wedge. The length of the wedge in $BTK is (830 - 800). By adding 30 to the breakout level of 800, we get the target of 830; 840 as the lifetime high of the index can also be considered to be the next target. As the index gets closer to its target and all-time high, the individual stock may also offer good buying. I would recommend strict profit booking around 830 and 840, considering the importance of those levels. |
|
| FIGURE 1: BTK, DAILY. The bullish wedge and the reaction move and breakout gives birth to a new upside rally; 840 remains the final target for this rally, with strict profit adviceable |
| Graphic provided by: StockCharts.com. |
| |
| Let's examine what the relative strength index (RSI) and the moving average convergence/divergence (MACD) indicates. At the 840 level on the index, the RSI was highly overbought. The RSI can remain overbought for a longer period, but in Figure 1, the trader can note that the indicator made a lower low and established support at the 50 level. So the RSI still has the bullish strength to carry the price toward its previous high. The MACD (12, 26, 9 ) gave a bearish crossover during the reaction move but has remained above its zero line, which is the positive outlook for this indicator. |
|
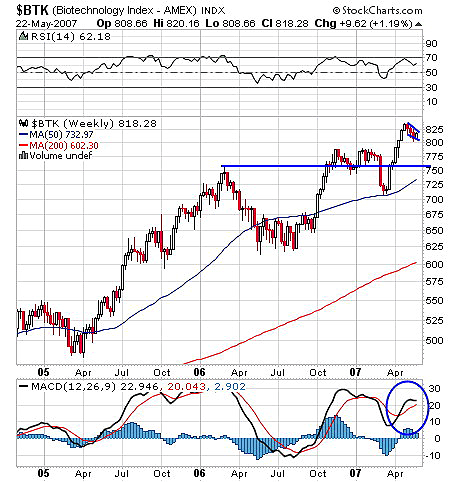
| FIGURE 2: BTK, WEEKLY. The bullish wedge on this chart has yet to break out. |
| Graphic provided by: StockCharts.com. |
| |
| On Figure 2, 750 proved to be the strong support level during the consolidation at the 775 level. The bullish rally with the support of 50-period moving average also moved strongly above the 750 support level. In Figure 2, the similar falling wedge is formed in the daily time frame. Though the price has yet to break out, the target will remain the same. The RSI (14) is overbought at 62 and indicates more space for the bullish rally. The MACD (12, 26, 9) is positive throughout the rally of 120 points. |
| With this breakout of a bullish wedge, traders should look for the individual equities for more buying opportunities and be watchful for the 840 level on the biotechnology index. Strict profit booking is advised and also individual biotechnology stocks around this same level. |
Active trader in the Indian stock markets since 2003 and a full-time writer. Trading is largely based upon technical analysis.
| Company: | Independent |
| Address: | C1/3 Parth Indraprasth Towers. Vastrapur |
| Ahmedabad, Guj 380015 | |
| E-mail address: | chaitalimohile@yahoo.co.in |
Traders' Resource Links | |
| Independent has not added any product or service information to TRADERS' RESOURCE. | |
Click here for more information about our publications!
Comments
Date:�06/05/07Rank:�5Comment:�

Request Information From Our Sponsors
- StockCharts.com, Inc.
- Candle Patterns
- Candlestick Charting Explained
- Intermarket Technical Analysis
- John Murphy on Chart Analysis
- John Murphy's Chart Pattern Recognition
- John Murphy's Market Message
- MurphyExplainsMarketAnalysis-Intermarket Analysis
- MurphyExplainsMarketAnalysis-Visual Analysis
- StockCharts.com
- Technical Analysis of the Financial Markets
- The Visual Investor
- VectorVest, Inc.
- Executive Premier Workshop
- One-Day Options Course
- OptionsPro
- Retirement Income Workshop
- Sure-Fire Trading Systems (VectorVest, Inc.)
- Trading as a Business Workshop
- VectorVest 7 EOD
- VectorVest 7 RealTime/IntraDay
- VectorVest AutoTester
- VectorVest Educational Services
- VectorVest OnLine
- VectorVest Options Analyzer
- VectorVest ProGraphics v6.0
- VectorVest ProTrader 7
- VectorVest RealTime Derby Tool
- VectorVest Simulator
- VectorVest Variator
- VectorVest Watchdog