HOT TOPICS LIST
- MACD
- Fibonacci
- RSI
- Gann
- ADXR
- Stochastics
- Volume
- Triangles
- Futures
- Cycles
- Volatility
- ZIGZAG
- MESA
- Retracement
- Aroon
INDICATORS LIST
LIST OF TOPICS
PRINT THIS ARTICLE
by Chaitali Mohile
American Superconductor Corp. has finally emerged from long consolidation.
Position: Buy
Chaitali Mohile
Active trader in the Indian stock markets since 2003 and a full-time writer. Trading is largely based upon technical analysis.
PRINT THIS ARTICLE
CONSOLID FORMATION
American Semiconductor Comes Out Of Consolidation
06/04/07 11:42:47 AMby Chaitali Mohile
American Superconductor Corp. has finally emerged from long consolidation.
Position: Buy
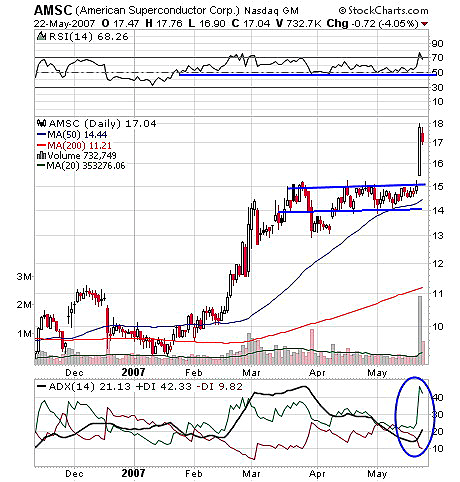
| American Superconductor Corp. (AMSC) began its bullish rally from $10 in February 2007. Though a slow mover, AMSC has offered steady returns since then. With a five-point advance rally, the stock has been in a long consolidation since the end of March until now. In Figure 1, you can see that volume also was reduced as the stock price moved in a much narrower range of $14-$15. |
| But the price has finally emerged from the range after almost two and a half months. The price sharply rose to $18 on improved volume. Such fast-running moves are high-risk trades, so trades are possible only during the cooling-off period. Prices may consolidate or even dip toward its previous support. AMSC is also likely to consolidate after its sudden three-point move. Traders can look for new buying above the $18 level. |
| In Figure 1, the relative strength index (RSI)(14) has remained bullish throughout the rally. Bullish strength in stock persists as the RSI has sustained above 50. Though the indicator moved in a 50-70 range, the price rallied five points. With a sudden move in the price, the RSI rallied above 70 but failed to sustain. Now, however, as the indicator tips down it holds its bullish strength. The dip in the RSI may result in the consolidation in price. And because trading during the consolidation phase is risky, the best entry level is above 18. The average directional movement index (ADX) (14) has moved to 20, indicating a developing strong uptrend. Though the price is likely to consolidate, the developing bullish trend will be intact. |

|
| FIGURE 1: AMSC, DAILY. This stock surged from long consolidation, resuming the bullish rally. A sudden three-point move may result in minor consolidation again before getting back to a target of $20. |
| Graphic provided by: StockCharts.com. |
| |
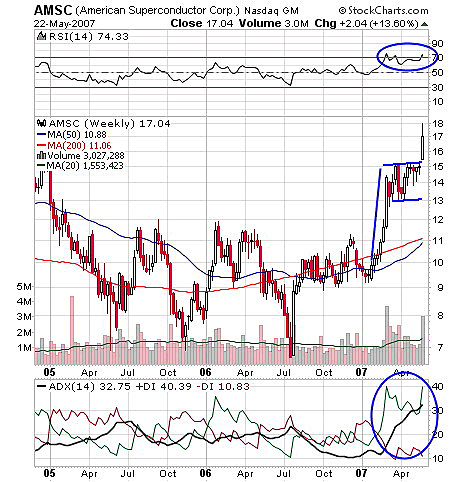
| Figure 2, the weekly chart, shows a flag & pennant formation. The formation is a continuation pattern of a previous advance rally. AMSC broke out with huge volume, moving up three points. The RSI (14) is at 74, indicating bullish strength in the rally. The ADX(14) is indicating a well-developed uptrend. To calculate the length of the target of breakout, the length of the flagpole is considered; (10 - 15 = 5) gives us the length of the flagpole. So by adding 5 to the breakout level of 15, we get the target of 20. AMSC has made a high of $20 in 2004, but the price has already moved to $18 in just a day. |

|
| FIGURE 2: AMSC, WEEKLY. A flag & pennant breakout may see the target of $20. |
| Graphic provided by: StockCharts.com. |
| |
| Traders should consider the possibility of consolidation after the fast move before taking any long position. Both indicators are providing a positive signal for buying opportunities. Thus, traders can look for a target of $20. |
Active trader in the Indian stock markets since 2003 and a full-time writer. Trading is largely based upon technical analysis.
| Company: | Independent |
| Address: | C1/3 Parth Indraprasth Towers. Vastrapur |
| Ahmedabad, Guj 380015 | |
| E-mail address: | chaitalimohile@yahoo.co.in |
Traders' Resource Links | |
| Independent has not added any product or service information to TRADERS' RESOURCE. | |
Click here for more information about our publications!
PRINT THIS ARTICLE

Request Information From Our Sponsors
- VectorVest, Inc.
- Executive Premier Workshop
- One-Day Options Course
- OptionsPro
- Retirement Income Workshop
- Sure-Fire Trading Systems (VectorVest, Inc.)
- Trading as a Business Workshop
- VectorVest 7 EOD
- VectorVest 7 RealTime/IntraDay
- VectorVest AutoTester
- VectorVest Educational Services
- VectorVest OnLine
- VectorVest Options Analyzer
- VectorVest ProGraphics v6.0
- VectorVest ProTrader 7
- VectorVest RealTime Derby Tool
- VectorVest Simulator
- VectorVest Variator
- VectorVest Watchdog
- StockCharts.com, Inc.
- Candle Patterns
- Candlestick Charting Explained
- Intermarket Technical Analysis
- John Murphy on Chart Analysis
- John Murphy's Chart Pattern Recognition
- John Murphy's Market Message
- MurphyExplainsMarketAnalysis-Intermarket Analysis
- MurphyExplainsMarketAnalysis-Visual Analysis
- StockCharts.com
- Technical Analysis of the Financial Markets
- The Visual Investor
