

HOT TOPICS LIST
- MACD
- Fibonacci
- RSI
- Gann
- ADXR
- Stochastics
- Volume
- Triangles
- Futures
- Cycles
- Volatility
- ZIGZAG
- MESA
- Retracement
- Aroon
INDICATORS LIST
LIST OF TOPICS
PRINT THIS ARTICLE
by Arthur Hill
After breaking resistance with a gap and a surge in April, Biogen Idec returned to the scene of the crime. This level should offer support.
Position: Accumulate
Arthur Hill
Arthur Hill is currently editor of TDTrader.com, a website specializing in trading strategies, sector/industry specific breadth stats and overall technical analysis. He passed the Society of Technical Analysts (STA London) diploma exam with distinction is a Certified Financial Technician (CFTe). Prior to TD Trader, he was the Chief Technical Analyst for Stockcharts.com and the main contributor to the ChartSchool.
PRINT THIS ARTICLE
MACD
Biogen Returns To The Breakout
05/24/07 10:36:20 AMby Arthur Hill
After breaking resistance with a gap and a surge in April, Biogen Idec returned to the scene of the crime. This level should offer support.
Position: Accumulate
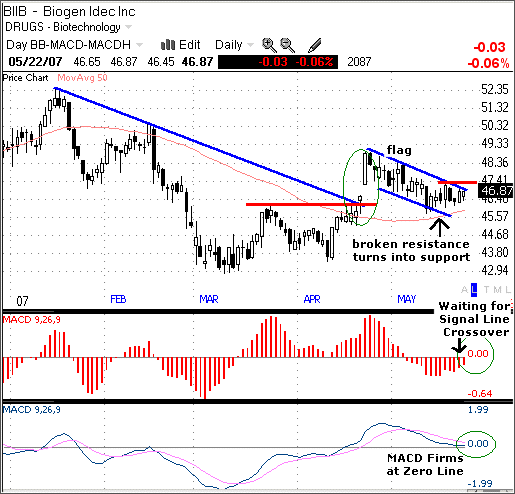
| Biogen Idec (BIIB) broke resistance in late April with a big gap and strong surge above 48. The move broke above the January trendline and the February high. The gap and long white candlestick show that there was clearly some power behind the breakout (green oval) (Figure 1). |
| Broken resistance turns into support, and BIIB returned to the breakout over the last few weeks. This is not uncommon, and a strong stock should hold support from its breakout. There is also support in this area from the 50-day moving average, which acted as resistance in mid-April. Failure to hold above 45.5 would show weakness and likely lead to a test of the March low. |
| The decline over the last few weeks formed a falling flag, and I am watching resistance at 47.5 for a breakout. Flags represent mild corrections, and bullish flags slope down. A move above 47.5 would signal a continuation of the April surge and target a move to around 53, which is resistance from the December high. |
|
| FIGURE 1: BIOGEN, DAILY. BIIB broke resistance in late April with a gap and a strong surge above 48. The move broke above the January trendline and the February high. The gap and long white candlestick show that there was clearly some power behind the breakout (green oval). |
| Graphic provided by: Telechart 2007. |
| |
| I am also looking for the moving average convergence/divergence (MACD) to cross above its signal line for confirmation. The MACD histogram (red) shows the difference between the MACD and its signal line. The histogram is positive when the MACD is above its signal line and negative when the MACD is below its signal line. The MACD is firming just above the zero line, and a move above the signal line would signal an upturn in momentum. |
Arthur Hill is currently editor of TDTrader.com, a website specializing in trading strategies, sector/industry specific breadth stats and overall technical analysis. He passed the Society of Technical Analysts (STA London) diploma exam with distinction is a Certified Financial Technician (CFTe). Prior to TD Trader, he was the Chief Technical Analyst for Stockcharts.com and the main contributor to the ChartSchool.
| Title: | Editor |
| Company: | TDTrader.com |
| Address: | Willem Geetsstraat 17 |
| Mechelen, B2800 | |
| Phone # for sales: | 3215345465 |
| Website: | www.tdtrader.com |
| E-mail address: | arthurh@tdtrader.com |
Traders' Resource Links | |
| TDTrader.com has not added any product or service information to TRADERS' RESOURCE. | |
Click here for more information about our publications!
Comments

Request Information From Our Sponsors
- StockCharts.com, Inc.
- Candle Patterns
- Candlestick Charting Explained
- Intermarket Technical Analysis
- John Murphy on Chart Analysis
- John Murphy's Chart Pattern Recognition
- John Murphy's Market Message
- MurphyExplainsMarketAnalysis-Intermarket Analysis
- MurphyExplainsMarketAnalysis-Visual Analysis
- StockCharts.com
- Technical Analysis of the Financial Markets
- The Visual Investor
- VectorVest, Inc.
- Executive Premier Workshop
- One-Day Options Course
- OptionsPro
- Retirement Income Workshop
- Sure-Fire Trading Systems (VectorVest, Inc.)
- Trading as a Business Workshop
- VectorVest 7 EOD
- VectorVest 7 RealTime/IntraDay
- VectorVest AutoTester
- VectorVest Educational Services
- VectorVest OnLine
- VectorVest Options Analyzer
- VectorVest ProGraphics v6.0
- VectorVest ProTrader 7
- VectorVest RealTime Derby Tool
- VectorVest Simulator
- VectorVest Variator
- VectorVest Watchdog