HOT TOPICS LIST
- MACD
- Fibonacci
- RSI
- Gann
- ADXR
- Stochastics
- Volume
- Triangles
- Futures
- Cycles
- Volatility
- ZIGZAG
- MESA
- Retracement
- Aroon
INDICATORS LIST
LIST OF TOPICS
PRINT THIS ARTICLE
by David Penn
A pause in the crude oil bounce as oil stocks test historic highs.
Position: N/A
David Penn
Technical Writer for Technical Analysis of STOCKS & COMMODITIES magazine, Working-Money.com, and Traders.com Advantage.
PRINT THIS ARTICLE
RETRACEMENT
A Crude Pause
05/23/07 08:41:38 AMby David Penn
A pause in the crude oil bounce as oil stocks test historic highs.
Position: N/A
| It's too bad that the cost of fuel isn't tax-deductible in the same way that economists deduct "volatile food and energy prices" from the Consumer Price Index. While "soaringgasprices" (now one word) have gotten everyone's attention (and just as the term "summer driving season begins!" must somehow be included in every statement with "soaringgasprices"), there are some interesting developments in the charts of crude oil and crude oil stocks that could present a surprise in the form of milder prices going forward. |
| Crude oil, for example, topped in the summer of 2006 and spent the next half-year falling in a bear market that saw the commodity lose some 30% of its value (basis continuous futures). By January, crude was showing signs of putting in a bottom, and the commodity began to move higher. Looking at near-term contracts, we can see that this advance ran into resistance near the area of the consolidation highs from the autumn of 2006. (I wrote about this resistance for Traders.com Advantage earlier this spring; see my "June Crude Rally Retreats At Resistance," March 16, 2007.) |

|
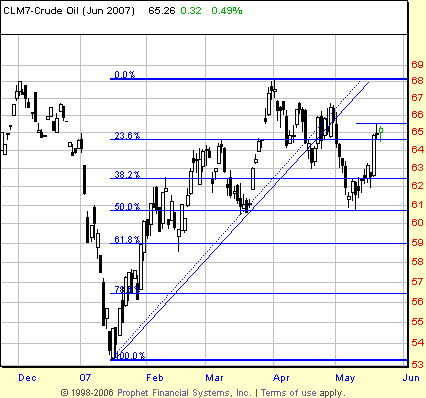
| FIGURE 1: CRUDE OIL, JUNE FUTURES, DAILY. A breakdown beneath a two-month trendline finds support near the 50% retracement level. The new low set during the correction, however, suggests trouble for the bounce higher in the immediate term. |
| Graphic provided by: Prophet Financial, Inc. |
| |
| Crude oil failed at resistance. But while crude set a new low in May vis-a-vis April (Figure 1), the fact that the March lows held open the possibility that the commodity would find support near 61 (basis June) and resume the rally that began in January. That possibility remains open. But over the past few days, crude oil has shown the sort of weariness that begets further correction. This weakness comes not only as crude tries to rally above the April highs, but also as oil stocks -- as measured by the oil service stock HOLDRS or OIH -- make a major test of their all-time highs. See Figure 2. Let's take a closer look at the move in crude. Crude bottomed in January and topped in late March (basis June). Since the March top, crude broke down below its January-March trendline in mid-April, rallied back above that trendline in the second half of the month, and broke down again in early May. In doing so, crude oil has begun to set up a 1-2-3 trendline reversal pattern. So far, step 1, the breaking of the trendline, has been completed. Step 2 appears to be under way right now as crude oil attempts to resume the January-March uptrend. Step 3, if it occurs, would have crude oil failing to set a new high and, instead, reversing and taking out the low established at the end of step 1. |

|
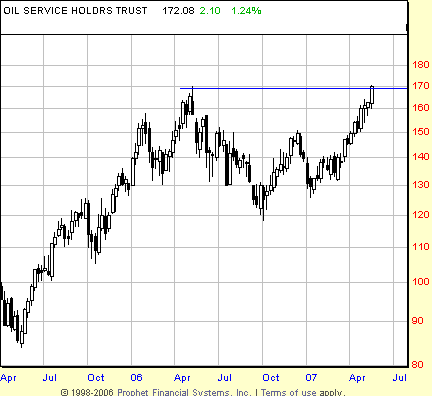
| FIGURE 2: OIL SERVICE HOLDRS (OIH), WEEKLY. Oil service stocks have been in rally mode since the beginning of 2007. A test of the 2006 highs — all-time highs — could lead to an overdue correction to this group. |
| Graphic provided by: Prophet Financial, Inc. |
| |
| The "end of step 1" -- the low point of the correction that began in April -- represents an almost 50% retracement of the January-March advance. This means that one argument occasionally made about corrections -- that they have not "corrected enough" -- does not apply here. However, any failure to set a new high vis-a-vis April will likely confirm the bearishness of lower month-to-month lows in crude. |
| I mentioned oil service stocks. The OIH is moving above 170, a level at which the HOLDRS last tested back in May 2006. This top in oil stocks served as an excellent warning for the underlying commodity, which topped out weeks late. As such, it will be worth watching to see if OIH shows follow-through to the upside after breaking out to new all-time highs in late May. Failure in this would open the door for a double top in the oil stocks (and levels in the OIH not seen since the first half of 2005). It would also open up the 50% retracement trap door in crude oil, likely setting up a move below the March, if not the February, lows. |
Technical Writer for Technical Analysis of STOCKS & COMMODITIES magazine, Working-Money.com, and Traders.com Advantage.
| Title: | Technical Writer |
| Company: | Technical Analysis, Inc. |
| Address: | 4757 California Avenue SW |
| Seattle, WA 98116 | |
| Phone # for sales: | 206 938 0570 |
| Fax: | 206 938 1307 |
| Website: | www.Traders.com |
| E-mail address: | DPenn@traders.com |
Traders' Resource Links | |
| Charting the Stock Market: The Wyckoff Method -- Books | |
| Working-Money.com -- Online Trading Services | |
| Traders.com Advantage -- Online Trading Services | |
| Technical Analysis of Stocks & Commodities -- Publications and Newsletters | |
| Working Money, at Working-Money.com -- Publications and Newsletters | |
| Traders.com Advantage -- Publications and Newsletters | |
| Professional Traders Starter Kit -- Software | |
Click here for more information about our publications!
Comments

Request Information From Our Sponsors
- StockCharts.com, Inc.
- Candle Patterns
- Candlestick Charting Explained
- Intermarket Technical Analysis
- John Murphy on Chart Analysis
- John Murphy's Chart Pattern Recognition
- John Murphy's Market Message
- MurphyExplainsMarketAnalysis-Intermarket Analysis
- MurphyExplainsMarketAnalysis-Visual Analysis
- StockCharts.com
- Technical Analysis of the Financial Markets
- The Visual Investor
- VectorVest, Inc.
- Executive Premier Workshop
- One-Day Options Course
- OptionsPro
- Retirement Income Workshop
- Sure-Fire Trading Systems (VectorVest, Inc.)
- Trading as a Business Workshop
- VectorVest 7 EOD
- VectorVest 7 RealTime/IntraDay
- VectorVest AutoTester
- VectorVest Educational Services
- VectorVest OnLine
- VectorVest Options Analyzer
- VectorVest ProGraphics v6.0
- VectorVest ProTrader 7
- VectorVest RealTime Derby Tool
- VectorVest Simulator
- VectorVest Variator
- VectorVest Watchdog
