HOT TOPICS LIST
- MACD
- Fibonacci
- RSI
- Gann
- ADXR
- Stochastics
- Volume
- Triangles
- Futures
- Cycles
- Volatility
- ZIGZAG
- MESA
- Retracement
- Aroon
INDICATORS LIST
LIST OF TOPICS
PRINT THIS ARTICLE
by Austin Passamonte
Since mid-March 2007, big-cap stock index markets seem to have a constant bid beneath them. Any intraday selloff that lasts into the closing bell is immediately reversed the next session. Most other days begin with early weakness before price action begins the inevitable grind upward into the afternoon.
Position: N/A
Austin Passamonte
Austin is a private trader who trades emini stock index futures intraday. He currently trades various futures markets from home in addition to managing a trader's educational forum
PRINT THIS ARTICLE
TECHNICAL ANALYSIS
Predictable Patterns Period
05/24/07 02:42:54 PMby Austin Passamonte
Since mid-March 2007, big-cap stock index markets seem to have a constant bid beneath them. Any intraday selloff that lasts into the closing bell is immediately reversed the next session. Most other days begin with early weakness before price action begins the inevitable grind upward into the afternoon.
Position: N/A
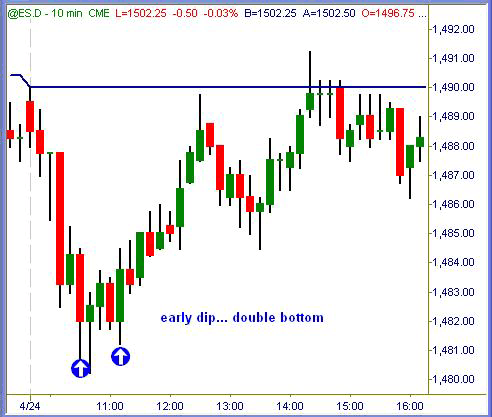
| This session from late April shows a double-bottom pattern following a gap down open. Like clockwork, price action soon persisted in grinding higher from there. See Figure 1. |

|
| FIGURE 1: EMINI S&P 500: 04/24 10-MINUTE |
| Graphic provided by: TradeStation. |
| |
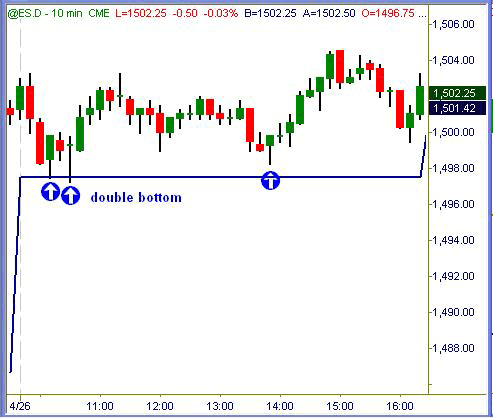
| Even the sideways sessions hold double-bottom patterns to work their way upward after tests of support hold. See Figure 2. |

|
| FIGURE 2: EMINI S&P 500: 04/26 10-MINUTE |
| Graphic provided by: TradeStation. |
| |
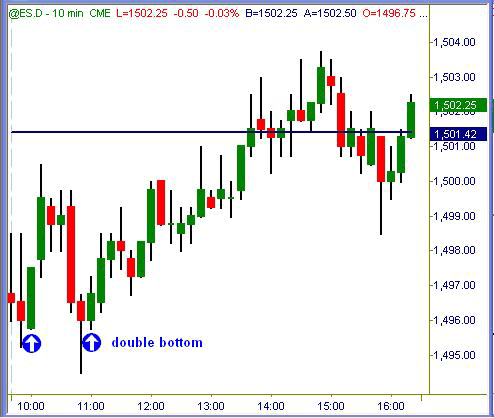
| There was another weak open, another double-bottom bounce from early lows followed by the stair-step grinding action higher. See Figure 3. |

|
| FIGURE 3: EMINI S&P 500: 04/29 10-MINUTE |
| Graphic provided by: TradeStation. |
| |
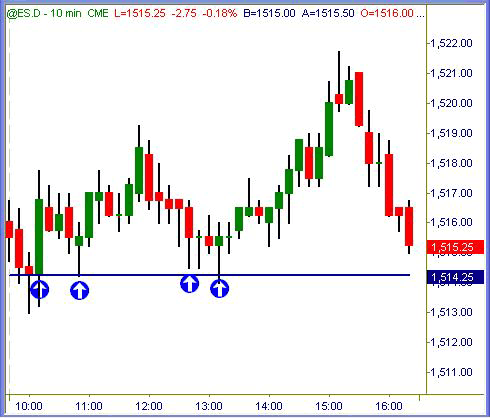
| On May 17, there was the same story: a daily pivot point holds multiple tests of support as price action bounces through tradable swings following each test. See Figure 4. |

|
| FIGURE 4: EMINI S&P 500: 05/17 10-MINUTE |
| Graphic provided by: TradeStation. |
| |
| "Buy dips" will not work forever, of course. But it is working now and has been for quite some time already. Until the uptrend pattern abates, each buy signal at or after any test of support has the high-odds nod for success. |
Austin is a private trader who trades emini stock index futures intraday. He currently trades various futures markets from home in addition to managing a trader's educational forum
| Title: | Individual Trader |
| Company: | CoiledMarkets.com |
| Address: | PO Box 633 |
| Naples, NY 14512 | |
| Website: | coiledmarkets.com/blog |
| E-mail address: | austinp44@yahoo.com |
Traders' Resource Links | |
| CoiledMarkets.com has not added any product or service information to TRADERS' RESOURCE. | |
Click here for more information about our publications!
PRINT THIS ARTICLE

Request Information From Our Sponsors
- StockCharts.com, Inc.
- Candle Patterns
- Candlestick Charting Explained
- Intermarket Technical Analysis
- John Murphy on Chart Analysis
- John Murphy's Chart Pattern Recognition
- John Murphy's Market Message
- MurphyExplainsMarketAnalysis-Intermarket Analysis
- MurphyExplainsMarketAnalysis-Visual Analysis
- StockCharts.com
- Technical Analysis of the Financial Markets
- The Visual Investor
- VectorVest, Inc.
- Executive Premier Workshop
- One-Day Options Course
- OptionsPro
- Retirement Income Workshop
- Sure-Fire Trading Systems (VectorVest, Inc.)
- Trading as a Business Workshop
- VectorVest 7 EOD
- VectorVest 7 RealTime/IntraDay
- VectorVest AutoTester
- VectorVest Educational Services
- VectorVest OnLine
- VectorVest Options Analyzer
- VectorVest ProGraphics v6.0
- VectorVest ProTrader 7
- VectorVest RealTime Derby Tool
- VectorVest Simulator
- VectorVest Variator
- VectorVest Watchdog
