HOT TOPICS LIST
- MACD
- Fibonacci
- RSI
- Gann
- ADXR
- Stochastics
- Volume
- Triangles
- Futures
- Cycles
- Volatility
- ZIGZAG
- MESA
- Retracement
- Aroon
INDICATORS LIST
LIST OF TOPICS
PRINT THIS ARTICLE
by Austin Passamonte
Pure price action can tell us a great deal about pending market direction. Intraday emini traders can see clear reversal signal patterns almost every session -- fair warning to exit existing trades and/or get ready for pending signals going the other way!
Position: N/A
Austin Passamonte
Austin is a private trader who trades emini stock index futures intraday. He currently trades various futures markets from home in addition to managing a trader's educational forum
PRINT THIS ARTICLE
TECHNICAL ANALYSIS
Reversal Warnings
05/24/07 12:36:14 PMby Austin Passamonte
Pure price action can tell us a great deal about pending market direction. Intraday emini traders can see clear reversal signal patterns almost every session -- fair warning to exit existing trades and/or get ready for pending signals going the other way!
Position: N/A
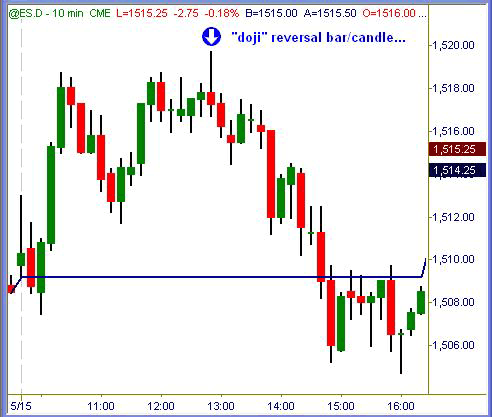
| Tuesday, May 17, saw the emini S&P 500 struggling to break a multiple-top formation after several attempts. The final tap of that price zone was sold into what most likely was a deliberate stop-run staged to clear weak shorts out and suck overzealous longs in while the big-money players sold into the stopped-out liquidity. Down it went from there, in a profitable fashion for those who heeded the reversal pattern warning. See Figure 1. |

|
| FIGURE 1: 05/15 ES 10-MINUTE |
| Graphic provided by: TradeStation. |
| |
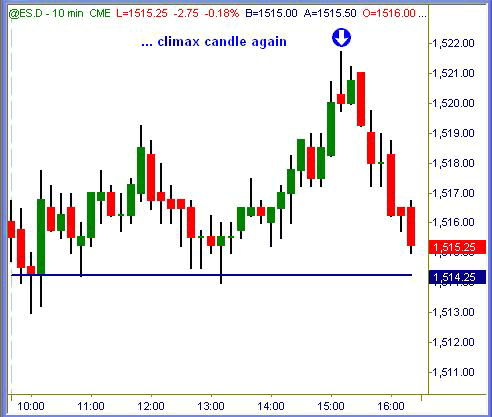
| Two days later -- May 17 in the late afternoon -- price action popped from the daily pivot point near 1514.25 and nearly reached 1522. Buy programs lifting to those levels got sold hard, forming another reversal candle pattern. Shorting below the lows near 1520 offered several points' potential profit downside, in telegraphed fashion. |

|
| FIGURE 2: 05/17 ES 10-MINUTE |
| Graphic provided by: TradeStation. |
| |
| In addition, we can see a triple-bottom formation near 1514 where three different candle/bar series popped to close with long tails, right before buy programs swung price action higher. Each of these patterns offered several points' profit potential per subsequent swing. See Figure 2. |
| Be it candle or bar charts, spotting these reversal patterns at high/low extremes or multiple tops/bottoms give savvy traders a clear heads-up that the next directional move is likely to turn, and soon. |
Austin is a private trader who trades emini stock index futures intraday. He currently trades various futures markets from home in addition to managing a trader's educational forum
| Title: | Individual Trader |
| Company: | CoiledMarkets.com |
| Address: | PO Box 633 |
| Naples, NY 14512 | |
| Website: | coiledmarkets.com/blog |
| E-mail address: | austinp44@yahoo.com |
Traders' Resource Links | |
| CoiledMarkets.com has not added any product or service information to TRADERS' RESOURCE. | |
Click here for more information about our publications!
PRINT THIS ARTICLE

Request Information From Our Sponsors
- StockCharts.com, Inc.
- Candle Patterns
- Candlestick Charting Explained
- Intermarket Technical Analysis
- John Murphy on Chart Analysis
- John Murphy's Chart Pattern Recognition
- John Murphy's Market Message
- MurphyExplainsMarketAnalysis-Intermarket Analysis
- MurphyExplainsMarketAnalysis-Visual Analysis
- StockCharts.com
- Technical Analysis of the Financial Markets
- The Visual Investor
- VectorVest, Inc.
- Executive Premier Workshop
- One-Day Options Course
- OptionsPro
- Retirement Income Workshop
- Sure-Fire Trading Systems (VectorVest, Inc.)
- Trading as a Business Workshop
- VectorVest 7 EOD
- VectorVest 7 RealTime/IntraDay
- VectorVest AutoTester
- VectorVest Educational Services
- VectorVest OnLine
- VectorVest Options Analyzer
- VectorVest ProGraphics v6.0
- VectorVest ProTrader 7
- VectorVest RealTime Derby Tool
- VectorVest Simulator
- VectorVest Variator
- VectorVest Watchdog
