HOT TOPICS LIST
- MACD
- Fibonacci
- RSI
- Gann
- ADXR
- Stochastics
- Volume
- Triangles
- Futures
- Cycles
- Volatility
- ZIGZAG
- MESA
- Retracement
- Aroon
INDICATORS LIST
LIST OF TOPICS
PRINT THIS ARTICLE
by David Penn
A pair of 2B tops helps mark the upper boundary of an ascending triangle.
Position: N/A
David Penn
Technical Writer for Technical Analysis of STOCKS & COMMODITIES magazine, Working-Money.com, and Traders.com Advantage.
PRINT THIS ARTICLE
TRIANGLES
The S&P 500's Intraday Ascending Triangle
05/17/07 03:24:12 PMby David Penn
A pair of 2B tops helps mark the upper boundary of an ascending triangle.
Position: N/A
| Just yesterday I described a pair of 2B tops in the hourly chart of the June emini Standard & Poor's 500 futures contract ("Intraday 2B Tops In The June Emini S&P 500," Traders.com Advantage, May 16, 2007). Breakdowns from the 2B tops in both instances provided traders with quality opportunities for a short-term bet against a market that had been rallying since the beginning of the month. |
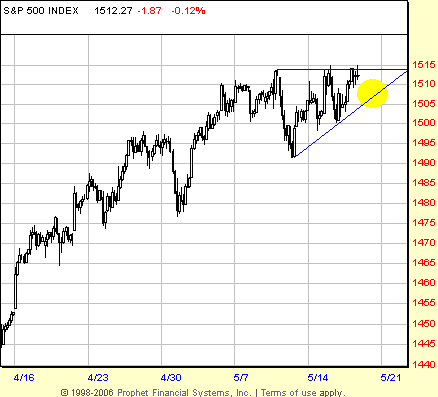
| Increasingly it appears, however, as if those two tops, rather than anticipating major reversals, were instead delineating the upper resistance level of an ascending triangle pattern. While this pattern is less vivid in the chart of the emini futures, the triangle — and its bullish implications — is clear in the hourly chart of the S&P 500 (Figure 1). With an upper resistance level at approximately 1514 and a pattern low of about 1492, a successful breakout from this triangle should take the S&P 500 to as high as 1536 in a minimum upside move. |

|
| FIGURE 1: STANDARD & POOR’S 500, HOURLY. An ascending triangle develops in the middle of May. A successful breakout should bring higher prices toward the end of the month and into June, setting up the possibility of a test of the all-time closing high at approximately 1527. |
| Graphic provided by: Prophet Financial, Inc. |
| |
| Triangles need to be touched. Thomas Bulkowski notes in his Encyclopedia Of Chart Patterns that there should be a "crossing pattern," by which he means "Price should cross the chart pattern several times; they should not leave a vast amount of white space in the center of the triangle." Elsewhere, others have suggested three to five touches (or including near misses) between the horizontal resistance line and the upwardly sloping support line. |
| In either event, it looks as if the S&P 500 is well on its way to filling out the ascending triangle pattern insofar as it has already completed five distinct touches of those resistance and support lines. That said, it looks as if the S&P 500 might retreat to test the support line one more time before moving up and out of the pattern. If it is true that the ideal breakout from an ascending triangle comes somewhere between 2/3 and 3/4 of the way through the pattern, then just such a retest may be all the market needs in order to finish the triangle and move toward breakout. |

|
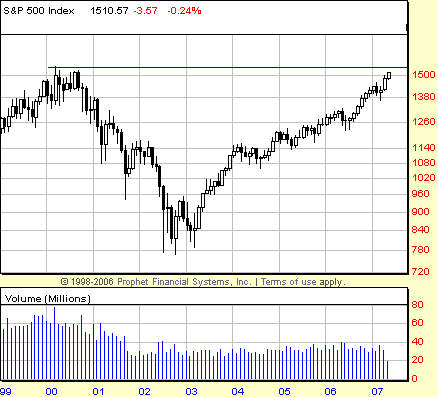
| FIGURE 2: STANDARD & POOR’S 500, MONTHLY. More than four years after its closing monthly low in late 2002, the S&P 500 has almost completely retraced the 2000–02 bear market. |
| Graphic provided by: Prophet Financial, Inc. |
| |
| It probably should be noted that the S&P 500 is tantalizingly close to its all-time high closing price of 1527 from the spring of 2000 (Figure 2). And a successful breakout from this ascending triangle — "successful" meaning a breakout that reaches its minimum price objective — would take the S&P 500 straight through that level with room to spare. |
Technical Writer for Technical Analysis of STOCKS & COMMODITIES magazine, Working-Money.com, and Traders.com Advantage.
| Title: | Technical Writer |
| Company: | Technical Analysis, Inc. |
| Address: | 4757 California Avenue SW |
| Seattle, WA 98116 | |
| Phone # for sales: | 206 938 0570 |
| Fax: | 206 938 1307 |
| Website: | www.Traders.com |
| E-mail address: | DPenn@traders.com |
Traders' Resource Links | |
| Charting the Stock Market: The Wyckoff Method -- Books | |
| Working-Money.com -- Online Trading Services | |
| Traders.com Advantage -- Online Trading Services | |
| Technical Analysis of Stocks & Commodities -- Publications and Newsletters | |
| Working Money, at Working-Money.com -- Publications and Newsletters | |
| Traders.com Advantage -- Publications and Newsletters | |
| Professional Traders Starter Kit -- Software | |
Click here for more information about our publications!
Comments

|

Request Information From Our Sponsors
- StockCharts.com, Inc.
- Candle Patterns
- Candlestick Charting Explained
- Intermarket Technical Analysis
- John Murphy on Chart Analysis
- John Murphy's Chart Pattern Recognition
- John Murphy's Market Message
- MurphyExplainsMarketAnalysis-Intermarket Analysis
- MurphyExplainsMarketAnalysis-Visual Analysis
- StockCharts.com
- Technical Analysis of the Financial Markets
- The Visual Investor
- VectorVest, Inc.
- Executive Premier Workshop
- One-Day Options Course
- OptionsPro
- Retirement Income Workshop
- Sure-Fire Trading Systems (VectorVest, Inc.)
- Trading as a Business Workshop
- VectorVest 7 EOD
- VectorVest 7 RealTime/IntraDay
- VectorVest AutoTester
- VectorVest Educational Services
- VectorVest OnLine
- VectorVest Options Analyzer
- VectorVest ProGraphics v6.0
- VectorVest ProTrader 7
- VectorVest RealTime Derby Tool
- VectorVest Simulator
- VectorVest Variator
- VectorVest Watchdog
