HOT TOPICS LIST
- MACD
- Fibonacci
- RSI
- Gann
- ADXR
- Stochastics
- Volume
- Triangles
- Futures
- Cycles
- Volatility
- ZIGZAG
- MESA
- Retracement
- Aroon
INDICATORS LIST
LIST OF TOPICS
PRINT THIS ARTICLE
by David Penn
"What we have here is a failure to follow through..."
Position: N/A
David Penn
Technical Writer for Technical Analysis of STOCKS & COMMODITIES magazine, Working-Money.com, and Traders.com Advantage.
PRINT THIS ARTICLE
REVERSAL
Intraday 2B Tops In The June Emini S&P 500
05/16/07 02:54:30 PMby David Penn
"What we have here is a failure to follow through..."
Position: N/A
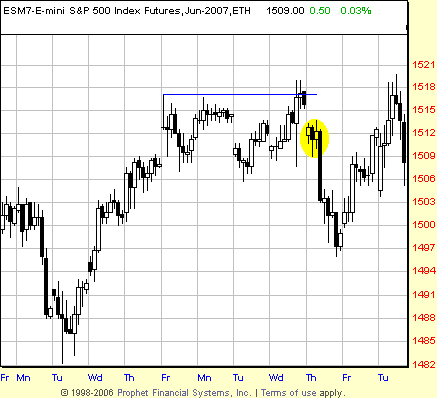
| With apologies to the captain in Cool Hand Luke, the rally in the Standard & Poor's 500 that began on the first of May has finally run into its own Cool Hand Luke moment, as the intraday highs in the June emini S&P 500 on May 9 were bested by the highs of May 15, only to have the market reverse and begin moving sharply lower. See Figure 1. |
| What is especially interesting about this failure to follow through is not just that it took the form of a 2B top. If you look at the sudden collapse on May 10, then you can see that a 2B top anticipated that correction as well. |

|
| FIGURE 1: EMINI STANDARD & POOR’S 500, JUNE FUTURES, HOURLY. The highs on Friday morning were exceeded by the highs in the afternoon on the following Wednesday. But the failure of the market on Wednesday to continue moving higher signaled a short opportunity for reversal traders. |
| Graphic provided by: Prophet Financial, Inc. |
| |
| To recap, a 2B top occurs when a market makes a high, pulls back, makes a higher high, then fails to follow through to the upside in the wake of the second higher high. The 2B top becomes a confirmed reversal when the market moves back down below the low of the initial high, which is where traders and speculators are encouraged to take their positions. |
| In the first 2B top — from May 4 to May 9, with the breakdown on May 10 — the market was able to trade above the May 4th high and even close above it briefly. But the selling in the final trading hour and the gap down the following day (see the highlighted oval in Figure 1) confirmed that the market was not likely to follow through to the upside but, instead, was in the process of reversing. |

|
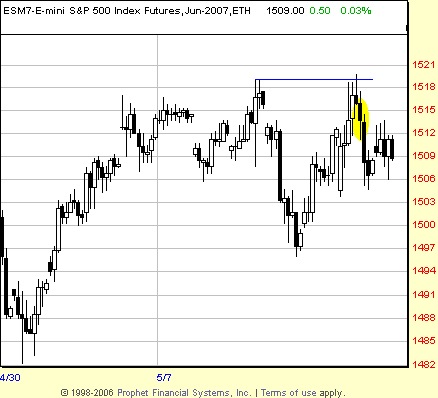
| FIGURE 2: EMINI STANDARD & POOR’S 500, JUNE FUTURES, HOURLY. The reversal was swift in coming as the bulls were unable to push the June emini higher on May 15. An hour after the new “intrahour” high was made, the market was being pushed significantly lower by the bears. |
| Graphic provided by: Prophet Financial, Inc. |
| |
| In the second 2B top — from May 9 to May 15 — the reversal from the second new high was even swifter (Figure 2). The candlestick that formed the second high was itself suspiciously bearish, with a long upper shadow indicating waning buying interest over the course of the session and a close that was below the open. So perhaps it was of little surprise when the following session opened down and the market continued to move lower. The highlighted area again shows the short entry level as the low of the initial high is taken out to the downside. |
Technical Writer for Technical Analysis of STOCKS & COMMODITIES magazine, Working-Money.com, and Traders.com Advantage.
| Title: | Technical Writer |
| Company: | Technical Analysis, Inc. |
| Address: | 4757 California Avenue SW |
| Seattle, WA 98116 | |
| Phone # for sales: | 206 938 0570 |
| Fax: | 206 938 1307 |
| Website: | www.Traders.com |
| E-mail address: | DPenn@traders.com |
Traders' Resource Links | |
| Charting the Stock Market: The Wyckoff Method -- Books | |
| Working-Money.com -- Online Trading Services | |
| Traders.com Advantage -- Online Trading Services | |
| Technical Analysis of Stocks & Commodities -- Publications and Newsletters | |
| Working Money, at Working-Money.com -- Publications and Newsletters | |
| Traders.com Advantage -- Publications and Newsletters | |
| Professional Traders Starter Kit -- Software | |
Click here for more information about our publications!
Comments
Date: 05/17/07Rank: 5Comment:

Request Information From Our Sponsors
- StockCharts.com, Inc.
- Candle Patterns
- Candlestick Charting Explained
- Intermarket Technical Analysis
- John Murphy on Chart Analysis
- John Murphy's Chart Pattern Recognition
- John Murphy's Market Message
- MurphyExplainsMarketAnalysis-Intermarket Analysis
- MurphyExplainsMarketAnalysis-Visual Analysis
- StockCharts.com
- Technical Analysis of the Financial Markets
- The Visual Investor
- VectorVest, Inc.
- Executive Premier Workshop
- One-Day Options Course
- OptionsPro
- Retirement Income Workshop
- Sure-Fire Trading Systems (VectorVest, Inc.)
- Trading as a Business Workshop
- VectorVest 7 EOD
- VectorVest 7 RealTime/IntraDay
- VectorVest AutoTester
- VectorVest Educational Services
- VectorVest OnLine
- VectorVest Options Analyzer
- VectorVest ProGraphics v6.0
- VectorVest ProTrader 7
- VectorVest RealTime Derby Tool
- VectorVest Simulator
- VectorVest Variator
- VectorVest Watchdog
