HOT TOPICS LIST
- MACD
- Fibonacci
- RSI
- Gann
- ADXR
- Stochastics
- Volume
- Triangles
- Futures
- Cycles
- Volatility
- ZIGZAG
- MESA
- Retracement
- Aroon
INDICATORS LIST
LIST OF TOPICS
PRINT THIS ARTICLE
by Dennis D. Peterson
If you combined the best features of RSI and stochastics into a single indicator, how well would it perform as a simple trading system?
Position: N/A
Dennis D. Peterson
Market index trading on a daily basis.
PRINT THIS ARTICLE
STOCHASTICS
Stochastic RSI and Nasdaq
12/11/00 02:49:58 PMby Dennis D. Peterson
If you combined the best features of RSI and stochastics into a single indicator, how well would it perform as a simple trading system?
Position: N/A
| Stochastics measures the position of the current closing price within a range of recent prices. RSI, on the other hand, measures how many days prices have been up versus how many days prices have been down for a recent period. StochRSI measures RSI with respect to a recent range of RSI values. The formula for the stochastic of RSI for a given period is stochRSI = (RSI- lowest RSI )/(highest RSI-lowest RSI), and in Metastock this formula is periods:=Input("RSI periods",1,100,14); stochrsi:=(RSI(periods)-LLV(RSI(periods),periods))/(HHV(RSI(periods),periods)-LLV(RSI(periods),periods)); stochrsi Like stochastic, stochRSI will range between zero and one. Since you are calculating where RSI fits in a range of recent values of RSI, stochRSI is going to be more responsive than RSI alone. |
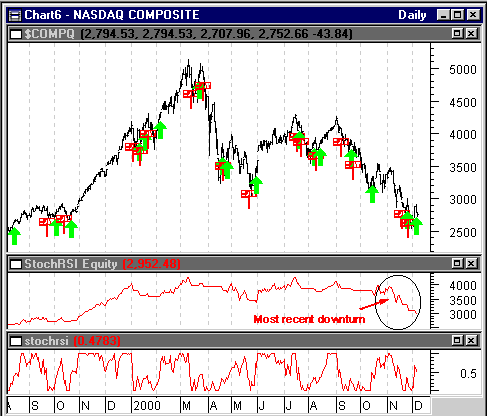
| StochRSI is intended to show overbought and oversold levels, as well as the trend in RSI. I experimented with different period values and found that in a volatile market, short periods frequently cause stochRSI to be zero or one, making its use as a trend indicator difficult. On the other side of the coin I could see that it might function better as an overbought/oversold indicator with less dependence on period value. If it is reliable as an overbought/oversold indicator, you should be able to trade with stochRSI. I decided to create a simple trading system for the Nasdaq using stochRSI. I would enter long if stochRSI was above an optimized value and exit the long position if stochRSI was below an optimized value. I also decided to let the system optimize on the number of periods. For the last five years of Nasdaq price history, optimization resulted in a period of 24 days, to enter long when stochRSI was greater than 0.3, and to exit long when stochRSI was below 0.3. When I optimized over the last 6 months of the Nasdaq, one of the differences was that optimization chose a period of 21 days and an entry threshold of 0.8.This means that you need to chart stochRSI to see where overbought and oversold thresholds are occurring. |

|
| Figure 1: Nasdaq Composite (top chart), Investment History(middle chart), and Stochastic RSI (lower chart). |
| Graphic provided by: MetaStock. |
| Graphic provided by: Data vendor: eSignal<. |
| |
| When you look at the investment history (Figure 1:middle chart), the horizontal lines show where stochRSI was out of the market for a long position. Therefore, the right hand end of a straight line is when a long position was entered and the left hand end when the long position was closed. What's interesting is that stochRSI is out of the market during significant downturns, which is what you want when holding long positions. Unfortunately, during the most recent downturn this wasn't the case. This means you need to adjust thresholds if you get on automatic pilot with a trading system. Otherwise this is a valid indicator and, like other Chande and Kroll indicators, is very responsive. |
Market index trading on a daily basis.
| Title: | Staff Writer |
| Company: | Technical Analysis, Inc. |
| Address: | 4757 California Ave SW |
| Seattle, WA 98116-4499 | |
| Phone # for sales: | 206 938 0570 |
| Fax: | 206 938 1307 |
| Website: | www.traders.com |
| E-mail address: | dpeterson@traders.com |
Traders' Resource Links | |
| Charting the Stock Market: The Wyckoff Method -- Books | |
| Working-Money.com -- Online Trading Services | |
| Traders.com Advantage -- Online Trading Services | |
| Technical Analysis of Stocks & Commodities -- Publications and Newsletters | |
| Working Money, at Working-Money.com -- Publications and Newsletters | |
| Traders.com Advantage -- Publications and Newsletters | |
| Professional Traders Starter Kit -- Software | |
Click here for more information about our publications!
Comments
Date: / /Rank: Comment: rbzsert7sx
Date: / /Rank: 5Comment: excellant !
Date: 07/18/01Rank: 2Comment:

|

Request Information From Our Sponsors
- VectorVest, Inc.
- Executive Premier Workshop
- One-Day Options Course
- OptionsPro
- Retirement Income Workshop
- Sure-Fire Trading Systems (VectorVest, Inc.)
- Trading as a Business Workshop
- VectorVest 7 EOD
- VectorVest 7 RealTime/IntraDay
- VectorVest AutoTester
- VectorVest Educational Services
- VectorVest OnLine
- VectorVest Options Analyzer
- VectorVest ProGraphics v6.0
- VectorVest ProTrader 7
- VectorVest RealTime Derby Tool
- VectorVest Simulator
- VectorVest Variator
- VectorVest Watchdog
- StockCharts.com, Inc.
- Candle Patterns
- Candlestick Charting Explained
- Intermarket Technical Analysis
- John Murphy on Chart Analysis
- John Murphy's Chart Pattern Recognition
- John Murphy's Market Message
- MurphyExplainsMarketAnalysis-Intermarket Analysis
- MurphyExplainsMarketAnalysis-Visual Analysis
- StockCharts.com
- Technical Analysis of the Financial Markets
- The Visual Investor
