HOT TOPICS LIST
- MACD
- Fibonacci
- RSI
- Gann
- ADXR
- Stochastics
- Volume
- Triangles
- Futures
- Cycles
- Volatility
- ZIGZAG
- MESA
- Retracement
- Aroon
INDICATORS LIST
LIST OF TOPICS
PRINT THIS ARTICLE
by David Penn
The bearish implications of a double top tip the scales toward a breakdown in July hogs.
Position: N/A
David Penn
Technical Writer for Technical Analysis of STOCKS & COMMODITIES magazine, Working-Money.com, and Traders.com Advantage.
PRINT THIS ARTICLE
DOUBLE TOPS
Heavy On The Hog
05/15/07 03:43:25 PMby David Penn
The bearish implications of a double top tip the scales toward a breakdown in July hogs.
Position: N/A
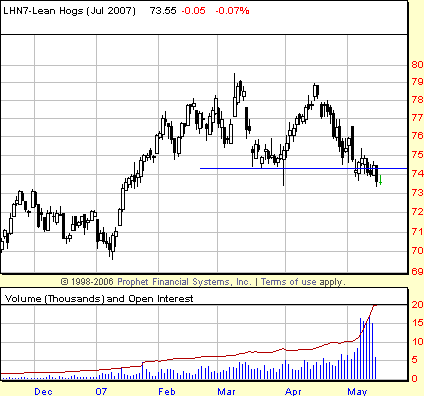
| Lean hogs roared into 2007, breaking free from a consolidation in mid-January that had prices pinned between 70 and 73 cents for two and a half months through November and December 2006. This range projected a minimum advance to the 76-cent level (basis July), a level that was reached just as February was beginning. Lean hogs continued to move higher into March before topping out near the 79-cent level. |
| A pullback and an attempt to set new highs failed significantly a month later, setting up the possibility of a test of the intrapeak lows. And not just any test. The combination of peaks in March and April created a standard double-top pattern in July lean hogs. The violation of the intrapeak low at, roughly, 74.50, meant a strong likelihood that prices would continue downward. Based on the size of the double top — roughly five points from highest point to lowest — would mean a minimum downside to 69.50. It is worth noting that the target area of 69.50 corresponds with the low point of the late 2006–early 2007 consolidation range. See Figure 1. |

|
| FIUGRE 1: LEAN HOGS, JULY FUTURES, DAILY. The breakdown from this double-top pattern projects down to the 69.50 level. This level coincides with the consolidation/correction low from the end of 2006–beginning of 2007. |
| Graphic provided by: Prophet Financial, Inc. |
| |
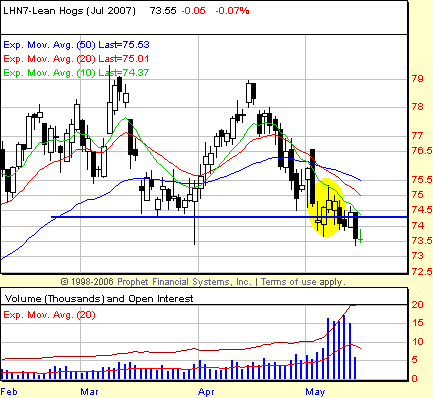
| July hogs have already accomplished this breakdown, with the 74.50 level breached on a closing basis in early May. The breakdown is further confirmed by the behavior of the three moving averages — the 10-, 20- and 50-day exponential moving averages — that created a bearish alignment a few days before the 74.50 level was broken on a closing basis. |

|
| FIGURE 2: LEAN HOGS, JULY FUTURES, DAILY. A bearish realignment in lean hogs confirms the breakdown from a double-top pattern that developed in the spring of 2007. |
| Graphic provided by: Prophet Financial, Inc. |
| |
| A bearish alignment — as I write in an article for Working Money — takes place when three moving averages of varying lengths fall into a pattern where the shortest is leading the intermediate-term moving average, and the intermediate-term moving average is leading the longer-term moving average (Figure 2). In the case of a market moving lower, this leadership would be expressed as the 20-day moving below the 50-day and the 10-day moving below the 20-day. |
| As of this writing, the bearish realignment in July hogs has just been confirmed. Bearish confirmation occurs when the market closes below the low of the session in which the realignment took place. In this case, the realignment was in place as of the close on May 4. The realignment was confirmed by the close on May 14, which exceeded the low of May 4. The entry level was approximately 73.60 (73.60 cents). |
Technical Writer for Technical Analysis of STOCKS & COMMODITIES magazine, Working-Money.com, and Traders.com Advantage.
| Title: | Technical Writer |
| Company: | Technical Analysis, Inc. |
| Address: | 4757 California Avenue SW |
| Seattle, WA 98116 | |
| Phone # for sales: | 206 938 0570 |
| Fax: | 206 938 1307 |
| Website: | www.Traders.com |
| E-mail address: | DPenn@traders.com |
Traders' Resource Links | |
| Charting the Stock Market: The Wyckoff Method -- Books | |
| Working-Money.com -- Online Trading Services | |
| Traders.com Advantage -- Online Trading Services | |
| Technical Analysis of Stocks & Commodities -- Publications and Newsletters | |
| Working Money, at Working-Money.com -- Publications and Newsletters | |
| Traders.com Advantage -- Publications and Newsletters | |
| Professional Traders Starter Kit -- Software | |
Click here for more information about our publications!
PRINT THIS ARTICLE

Request Information From Our Sponsors
- StockCharts.com, Inc.
- Candle Patterns
- Candlestick Charting Explained
- Intermarket Technical Analysis
- John Murphy on Chart Analysis
- John Murphy's Chart Pattern Recognition
- John Murphy's Market Message
- MurphyExplainsMarketAnalysis-Intermarket Analysis
- MurphyExplainsMarketAnalysis-Visual Analysis
- StockCharts.com
- Technical Analysis of the Financial Markets
- The Visual Investor
- VectorVest, Inc.
- Executive Premier Workshop
- One-Day Options Course
- OptionsPro
- Retirement Income Workshop
- Sure-Fire Trading Systems (VectorVest, Inc.)
- Trading as a Business Workshop
- VectorVest 7 EOD
- VectorVest 7 RealTime/IntraDay
- VectorVest AutoTester
- VectorVest Educational Services
- VectorVest OnLine
- VectorVest Options Analyzer
- VectorVest ProGraphics v6.0
- VectorVest ProTrader 7
- VectorVest RealTime Derby Tool
- VectorVest Simulator
- VectorVest Variator
- VectorVest Watchdog
