HOT TOPICS LIST
- MACD
- Fibonacci
- RSI
- Gann
- ADXR
- Stochastics
- Volume
- Triangles
- Futures
- Cycles
- Volatility
- ZIGZAG
- MESA
- Retracement
- Aroon
INDICATORS LIST
LIST OF TOPICS
PRINT THIS ARTICLE
by David Penn
Will the third triangle be the charm?
Position: N/A
David Penn
Technical Writer for Technical Analysis of STOCKS & COMMODITIES magazine, Working-Money.com, and Traders.com Advantage.
PRINT THIS ARTICLE
TRIANGLES
Silver Signals Higher ... And Lower
05/15/07 12:31:06 PMby David Penn
Will the third triangle be the charm?
Position: N/A
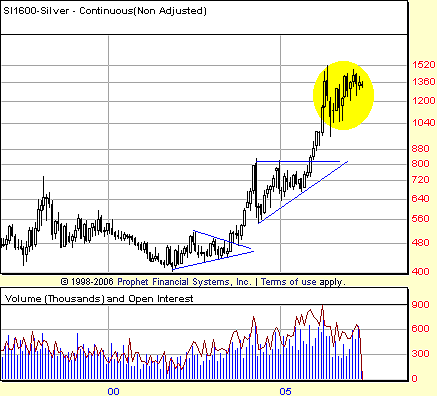
| Triangle patterns have been good to silver since the metal made a secular low in 2001. It was a symmetrical triangle in the monthly chart of silver futures that anticipated a breakout in mid-2003, a breakout that led to silver's first major advance in years. Basis continuous futures, silver broke out at about $4.80 and rallied to nearly $8.00 in the first quarter of 2004. (See Figure 1.) |

|
| FIGURE 1: SILVER, CONTINUOUS FUTURES, MONTHLY. Will the third triangle in silver's bull market be a charm and propel prices even higher? Previous triangle setups in silver in 2003 and 2004–05 led to major moves, post-breakout. |
| Graphic provided by: Prophet Financial, Inc. |
| |
| The 2003 breakout led, interestingly enough, to another triangle. This triangle was of the ascending variety, meaning it featured a flat, horizontal resistance level and an upwardly sloping support trendline. Such ascending triangles produce breakouts with a very strong bias to the upside, and in that, the ascending triangle in silver that began in 2003 and ended with a breakout near the end of 2005 did not disappoint. Breaking out near the $8.00 level (basis continuous futures), silver rallied to more than $14 in 2006 and -- after a pullback to the $9.60 level -- bested $14 again in early 2007. |
| Has silver formed still yet another triangle? While the price pattern in 2006 is not ideal, it does have the requisite horizontal resistance and upwardly sloping support trendline of a triangle -- and an ascending triangle at that. The size of the triangle is also attention-getting insofar as the pattern's width projects a minimum run to $20, should there be a successful breakout to the upside. Such prices for silver would not represent a new all-time high (the all-time high for silver remains north of $49) but would certainly represent an awesome achievement for a commodity that was trading for less than $5 only 10 years ago. |

|
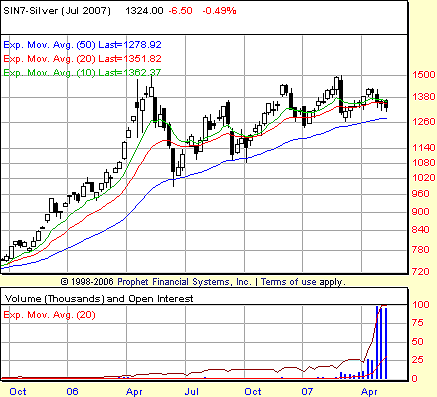
| FIGURE 2: SILVER, JULY FUTURES, WEEKLY. A pattern of higher highs and higher lows has developed in this pattern, one that otherwise resembles an ascending triangle. Failure to set a new high in the second quarter of 2007, however, is tentatively a bearish sign. This will be even more so if the lows from the first quarter of 2007 are taken out to the downside. |
| Graphic provided by: Prophet Financial, Inc. |
| |
| For now, silver remains in an uptrend in the weekly charts (Figure 2). Since a correction low in the first half of 2006, silver -- basis July futures -- has created a triangular pattern consisting of higher highs and higher lows. That higher highs and higher lows pattern is the signature of an advancing market and there is no technical "indicator" that should be allowed to override that reality. |

|
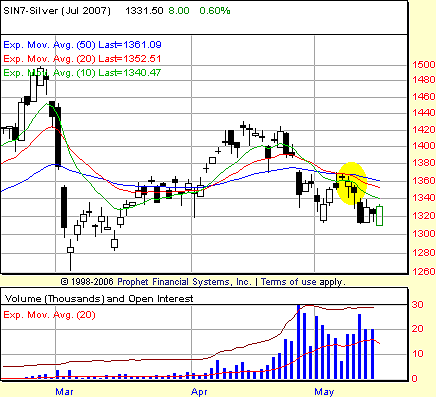
| FIGURE 3: SILVER, JULY FUTURES, DAILY. With all three moving averages moving into bearish alignment (the 10-day EMA below the 20-day EMA and the 20-day EMA below the 50-day EMA), the sell signal was confirmed as soon as the market closed below the low of the session when the alignment occurred. |
| Graphic provided by: Prophet Financial, Inc. |
| |
| That said, the daily chart of silver suggests some breaking down below key moving averages and moreover, the bearish realignment of key moving averages has turned into an outright sell signal -- see my Working Money article "Moving Average Trios" for more on bearish "realignment" patterns. As Figure 3 shows, the three moving averages (10-day, 20-day, and 50-day exponential) crossed in early May so that the shortest, fastest moving average was below the intermediate term (the 20-day EMA), and the intermediate term was below the longer term (the 50-day EMA). This marked the bearish realignment of the three moving averages as they switched from a largely bullish alignment with the shorter moving averages above the longer ones to a bearish one. This bearish realignment was confirmed the following day when July silver closed below the low of the session that marked the realignment. Since then, July silver has lost 36 cents or approximately $1,800/per contract. |
Technical Writer for Technical Analysis of STOCKS & COMMODITIES magazine, Working-Money.com, and Traders.com Advantage.
| Title: | Technical Writer |
| Company: | Technical Analysis, Inc. |
| Address: | 4757 California Avenue SW |
| Seattle, WA 98116 | |
| Phone # for sales: | 206 938 0570 |
| Fax: | 206 938 1307 |
| Website: | www.Traders.com |
| E-mail address: | DPenn@traders.com |
Traders' Resource Links | |
| Charting the Stock Market: The Wyckoff Method -- Books | |
| Working-Money.com -- Online Trading Services | |
| Traders.com Advantage -- Online Trading Services | |
| Technical Analysis of Stocks & Commodities -- Publications and Newsletters | |
| Working Money, at Working-Money.com -- Publications and Newsletters | |
| Traders.com Advantage -- Publications and Newsletters | |
| Professional Traders Starter Kit -- Software | |
Click here for more information about our publications!
Comments
Date: 05/15/07Rank: 4Comment:

Request Information From Our Sponsors
- StockCharts.com, Inc.
- Candle Patterns
- Candlestick Charting Explained
- Intermarket Technical Analysis
- John Murphy on Chart Analysis
- John Murphy's Chart Pattern Recognition
- John Murphy's Market Message
- MurphyExplainsMarketAnalysis-Intermarket Analysis
- MurphyExplainsMarketAnalysis-Visual Analysis
- StockCharts.com
- Technical Analysis of the Financial Markets
- The Visual Investor
- VectorVest, Inc.
- Executive Premier Workshop
- One-Day Options Course
- OptionsPro
- Retirement Income Workshop
- Sure-Fire Trading Systems (VectorVest, Inc.)
- Trading as a Business Workshop
- VectorVest 7 EOD
- VectorVest 7 RealTime/IntraDay
- VectorVest AutoTester
- VectorVest Educational Services
- VectorVest OnLine
- VectorVest Options Analyzer
- VectorVest ProGraphics v6.0
- VectorVest ProTrader 7
- VectorVest RealTime Derby Tool
- VectorVest Simulator
- VectorVest Variator
- VectorVest Watchdog
