HOT TOPICS LIST
- MACD
- Fibonacci
- RSI
- Gann
- ADXR
- Stochastics
- Volume
- Triangles
- Futures
- Cycles
- Volatility
- ZIGZAG
- MESA
- Retracement
- Aroon
INDICATORS LIST
LIST OF TOPICS
PRINT THIS ARTICLE
by Chaitali Mohile
CACB is in an intermediate downtrend. Will a bullish engulfing pattern really offer a reliable buying opportunity?
Position: N/A
Chaitali Mohile
Active trader in the Indian stock markets since 2003 and a full-time writer. Trading is largely based upon technical analysis.
PRINT THIS ARTICLE
CHART ANALYSIS
Cascade Bancorp Has A Bullish Engulfing Pattern
05/24/07 11:37:06 AMby Chaitali Mohile
CACB is in an intermediate downtrend. Will a bullish engulfing pattern really offer a reliable buying opportunity?
Position: N/A
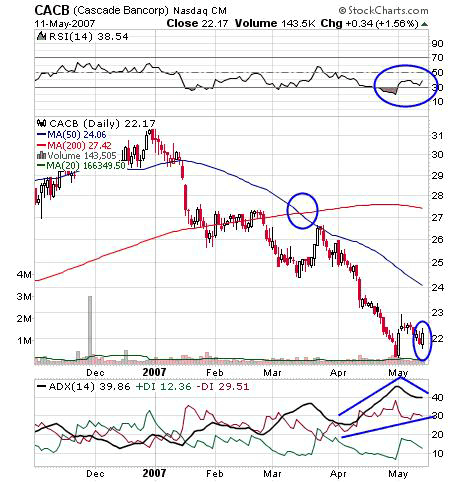
| Cascade Bancorp (CACB) entered an intermediate downtrend from January 2007. The stock went through many volatile sessions, whipsawing many traders. The strong downtrend began with a high made at $31 (Figure 1). The stock was thus dragged to its low level of $20, losing its profit of $11. The bullish engulfing candle creates some buying opportunity on stock. CACB formed an engulfing pattern on the Friday closing. Did it really open a buying position? |

|
| FIGURE 1: CACB, DAILY. A bearish moving average crossover and downtrend are not good conditions for new long positions. Bullish engulfing patterns on the daily chart is not suitable for fresh buying. |
| Graphic provided by: StockCharts.com. |
| |
| The stock made a bearish moving average crossover with a 50-day moving average below a 200-day moving average, and the price usually follows this moving average direction. So the price will first face two strong resistances of both moving averages, which can be violated, only on heavy volume or strong bullish strength. The relative strength index (RSI)(14) moved out of an oversold zone and rallied to $38 but still lacks positive strength. So the bullish engulfing pattern may face its first resistance of a 50-day moving average, and the RSI may lack positive strength. |
| The average directional movement index (ADX)(14) is 39 with a negative directional index (-DI) at 29. The ADX thus indicates a strong bearish trend. In such a scenario, any long position has the possibility of failing. There are traders who trade such small and risky positions of $2 (24 50-day moving average resistance - 22 bullish engulfing level), but wise traders need not take a long position on the stock in a downtrend. |

|
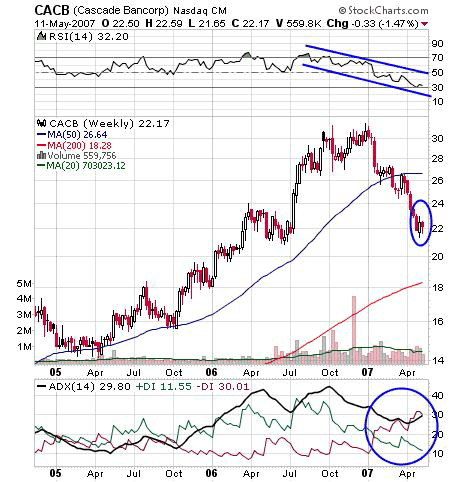
| FIGURE 2: CACB, WEEKLY. CACB may face a 50-day moving average resistance in its bullish move. |
| Graphic provided by: StockCharts.com. |
| |
| The weekly chart shows the effect of a double top formed at $31 (Figure 2). At every stage, the stock failed to hold its support. The 50-day moving average support was taken off, resulting in a serious fall in price. An 11-point correction rested with a minor consolidation. The price congestion is a temporary pause in the fall. The RSI(14) has declined from the 60 to the 30 level. The RSI(14) thus indicates a bearish sustaining rally. The ADX(14) at 29 shows a developing downtrend with increasing selling pressure. |
| Thus, the bullish engulfing pattern does not offer a reliable buying entry for traders. Since Cascade Bancorp is in a downtrend, this buying opportunity should be ignored. |
Active trader in the Indian stock markets since 2003 and a full-time writer. Trading is largely based upon technical analysis.
| Company: | Independent |
| Address: | C1/3 Parth Indraprasth Towers. Vastrapur |
| Ahmedabad, Guj 380015 | |
| E-mail address: | chaitalimohile@yahoo.co.in |
Traders' Resource Links | |
| Independent has not added any product or service information to TRADERS' RESOURCE. | |
Click here for more information about our publications!
PRINT THIS ARTICLE

Request Information From Our Sponsors
- StockCharts.com, Inc.
- Candle Patterns
- Candlestick Charting Explained
- Intermarket Technical Analysis
- John Murphy on Chart Analysis
- John Murphy's Chart Pattern Recognition
- John Murphy's Market Message
- MurphyExplainsMarketAnalysis-Intermarket Analysis
- MurphyExplainsMarketAnalysis-Visual Analysis
- StockCharts.com
- Technical Analysis of the Financial Markets
- The Visual Investor
- VectorVest, Inc.
- Executive Premier Workshop
- One-Day Options Course
- OptionsPro
- Retirement Income Workshop
- Sure-Fire Trading Systems (VectorVest, Inc.)
- Trading as a Business Workshop
- VectorVest 7 EOD
- VectorVest 7 RealTime/IntraDay
- VectorVest AutoTester
- VectorVest Educational Services
- VectorVest OnLine
- VectorVest Options Analyzer
- VectorVest ProGraphics v6.0
- VectorVest ProTrader 7
- VectorVest RealTime Derby Tool
- VectorVest Simulator
- VectorVest Variator
- VectorVest Watchdog
