HOT TOPICS LIST
- MACD
- Fibonacci
- RSI
- Gann
- ADXR
- Stochastics
- Volume
- Triangles
- Futures
- Cycles
- Volatility
- ZIGZAG
- MESA
- Retracement
- Aroon
INDICATORS LIST
LIST OF TOPICS
PRINT THIS ARTICLE
by Chaitali Mohile
The US Chemical Index has formed an ascending triangle on daily and weekly time frames and is now ready to break out.
Position: Buy
Chaitali Mohile
Active trader in the Indian stock markets since 2003 and a full-time writer. Trading is largely based upon technical analysis.
PRINT THIS ARTICLE
ASCENDING TRIANGLES
$DJUSCH Readies To Break Out From Ascending Triangle
05/24/07 01:55:10 PMby Chaitali Mohile
The US Chemical Index has formed an ascending triangle on daily and weekly time frames and is now ready to break out.
Position: Buy
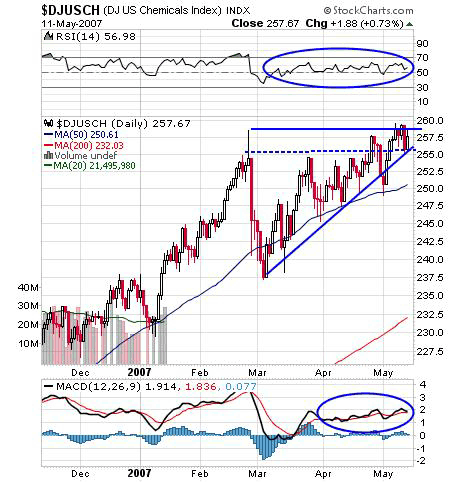
| $DJUSCH is in a strong uptrend but in late February, the index lost its bullish strength. Within a week it lost almost all its 20-point gains, but the 50-day moving average (MA) support held. In fact, every dip since that one established support at the 50-day MA, creating an ascending triangle. As a triangle matures, the volume reduces and expands on the breakout. In Figure 1, I identified two lines of resistance. I prefer using the line that is the higher of the two. |

|
| FIGURE 1: $DJUSCH, DAILY. Here's the ascending triangle in $DJUSCH. The breakout above 258 will bring a boom in individual stocks in the US Chemical Index, too. |
| Graphic provided by: StockCharts.com. |
| |
| The price target on an ascending triangle is measured using the length of the triangle. In this case, the length of the triangle is 257.5 - 237.5 = 20. So by adding 20 to the breakout level at 258, you can get a target level of 278. The breakout of this index will bring a great boom in individual chemical stocks, so keep an eye on it. |
| The relative strength index (RSI)(14) in Figure 1 shows ranging but bullish strength in an ongoing rally. The loss of 20 points in the price reflected no adverse effect on the RSI. The indicator marginally moved below 40, recovering faster. This shows positive strength in the rally. The moving average convergence/divergence (MACD)(12,26,9) moves close to its trigger line but directionless. The snake move can break out in any direction. Combining the MACD(12,26,9) volatility with other conditions on the chart's upside breakout of the triangle looks possible. |

|
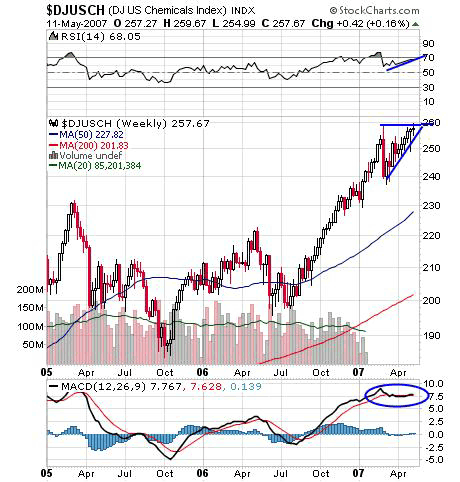
| FIGURE 2: $DJUSCH, WEEKLY. The ascending triangle on the weekly chart reinforces the breakout. The strong pattern will lead a fresh level of 278. |
| Graphic provided by: StockCharts.com. |
| |
| In Figure 2, the ascending triangle is formed. The same pattern on different time frames reinforces the breakout. The MACD(12,26,9) is neutral to its trigger line. The breakout of the triangle in the upward direction can give bullish crossover in the MACD(12,26,9). The RSI(14) is at 68 but still strong and has more room for an advanced rally. The RSI thus indicates that the breakout of the price will have a strong bullish force to reach the price target mentioned previously. |
| A breakout on $DJUSCH will bring attractive buying opportunities in individual equities of the same index. |
Active trader in the Indian stock markets since 2003 and a full-time writer. Trading is largely based upon technical analysis.
| Company: | Independent |
| Address: | C1/3 Parth Indraprasth Towers. Vastrapur |
| Ahmedabad, Guj 380015 | |
| E-mail address: | chaitalimohile@yahoo.co.in |
Traders' Resource Links | |
| Independent has not added any product or service information to TRADERS' RESOURCE. | |
Click here for more information about our publications!
PRINT THIS ARTICLE

Request Information From Our Sponsors
- StockCharts.com, Inc.
- Candle Patterns
- Candlestick Charting Explained
- Intermarket Technical Analysis
- John Murphy on Chart Analysis
- John Murphy's Chart Pattern Recognition
- John Murphy's Market Message
- MurphyExplainsMarketAnalysis-Intermarket Analysis
- MurphyExplainsMarketAnalysis-Visual Analysis
- StockCharts.com
- Technical Analysis of the Financial Markets
- The Visual Investor
- VectorVest, Inc.
- Executive Premier Workshop
- One-Day Options Course
- OptionsPro
- Retirement Income Workshop
- Sure-Fire Trading Systems (VectorVest, Inc.)
- Trading as a Business Workshop
- VectorVest 7 EOD
- VectorVest 7 RealTime/IntraDay
- VectorVest AutoTester
- VectorVest Educational Services
- VectorVest OnLine
- VectorVest Options Analyzer
- VectorVest ProGraphics v6.0
- VectorVest ProTrader 7
- VectorVest RealTime Derby Tool
- VectorVest Simulator
- VectorVest Variator
- VectorVest Watchdog
