HOT TOPICS LIST
- MACD
- Fibonacci
- RSI
- Gann
- ADXR
- Stochastics
- Volume
- Triangles
- Futures
- Cycles
- Volatility
- ZIGZAG
- MESA
- Retracement
- Aroon
INDICATORS LIST
LIST OF TOPICS
PRINT THIS ARTICLE
by Chaitali Mohile
$NDX is volatile and moving in a 20-point range for the last two weeks. The lower range can dip to the previous low of the rally.
Position: N/A
Chaitali Mohile
Active trader in the Indian stock markets since 2003 and a full-time writer. Trading is largely based upon technical analysis.
PRINT THIS ARTICLE
CONSOLID FORMATION
Volatile NASDAQ 100 Stays In Range
05/21/07 09:11:06 AMby Chaitali Mohile
$NDX is volatile and moving in a 20-point range for the last two weeks. The lower range can dip to the previous low of the rally.
Position: N/A
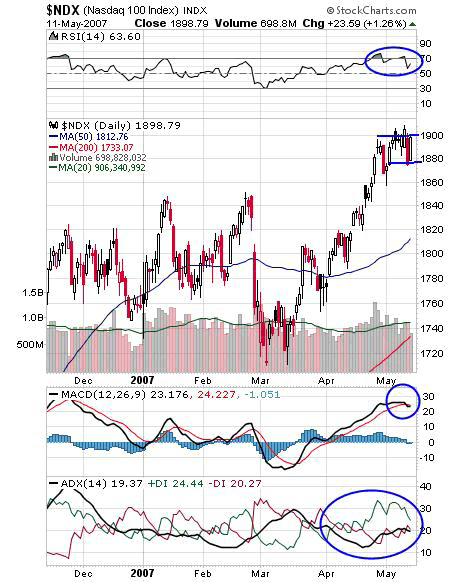
| On forming a double bottom at 1710 in mid-March, the NASDAQ 100 index rallied to its previous highs at about 1850. At that point, 1850 turned support for the next bullish rally, creating a new buying opportunity. The index moved vertically on expanded volume till the 1900 level, offering a 50-point profit to existing traders. The index now seems to rest with this advance rally of 50 points. The range-bound consolidation seems to have brought a temporary halt to this bullish rally. |
| The lower range of 1880 is the support, while the upper range of 1900 is resistance for the existing bull run (Figure 1). But the previous low of 1860 cannot be ignored. The volatile moves can whipsaw the traders, retracing toward the previous low. Meanwhile, the relative strength index (RSI) (14) turned marginally overbought. The overbought RSI can indicate an oncoming extended bullish rally, but $NDX lacked the force for such a rally, resulting in a consolidation after the advance rally. Traders can note that such a consolidation is healthy for future bullish moves in any stocks/index/sectors. |

|
| FIGURE 1: $NDX, DAILY. The NASDAQ 100 IS undergoing bullish consolidation. This figure shows the possibility of a lower range to dip toward its previous low. |
| Graphic provided by: StockCharts.com. |
| |
| The moving average convergence/divergence (MACD)(12,26,9) is volatile. Traders cannot judge the exact direction of the MACD (12,26,9) at the current stage. The average directional movement index (ADX)(14) is 19, which again indicate the possibility of consolidation. The positive directional index (+DI) is tipped down and the negative directional index (-DI) is moving with equal force. This points the lower range to dip at 1860. The long side force is likely to reduce as consolidation exceeds. Though the ADX currently points toward consolidation, above 22 the uptrend will grow stronger. |

|
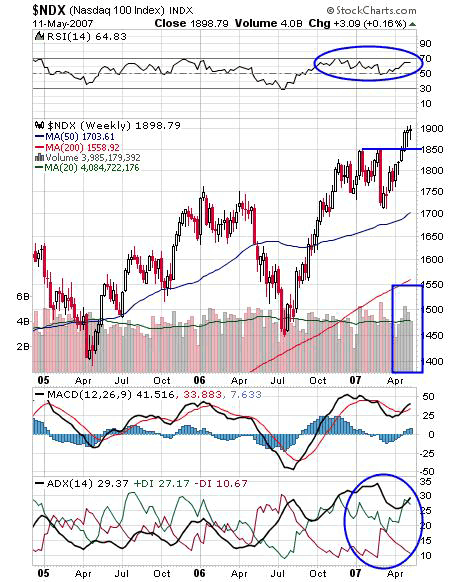
| FIGURE 2: $NDX, WEEKLY. The heavy volume breakout of a previous high resistance. A fresh rally above the resistance consolidated instead of moving ahead, but it remains bullish. |
| Graphic provided by: StockCharts.com. |
| |
| $NDX on Figure 2 has moved above its strong resistance on encouraging volume. The bulls ran from this resistance turned support to 1900. The two-doji candles formed in the last two weeks indicate indecision. In Figure 2, the ADX (14) is 29, indicating a developing uptrend. The doji formed is likely to reduce buyer interest during a consolidation phase. The MACD (12,26,9) has bullish crossover and is positive. |
| At present, the NASDAQ 100 is likely to consolidate and remain range-bound for some time. The breakout of the upper range will bring in more buyers, but till then, traders can avoid trades on this index. |
Active trader in the Indian stock markets since 2003 and a full-time writer. Trading is largely based upon technical analysis.
| Company: | Independent |
| Address: | C1/3 Parth Indraprasth Towers. Vastrapur |
| Ahmedabad, Guj 380015 | |
| E-mail address: | chaitalimohile@yahoo.co.in |
Traders' Resource Links | |
| Independent has not added any product or service information to TRADERS' RESOURCE. | |
Click here for more information about our publications!
PRINT THIS ARTICLE

Request Information From Our Sponsors
- StockCharts.com, Inc.
- Candle Patterns
- Candlestick Charting Explained
- Intermarket Technical Analysis
- John Murphy on Chart Analysis
- John Murphy's Chart Pattern Recognition
- John Murphy's Market Message
- MurphyExplainsMarketAnalysis-Intermarket Analysis
- MurphyExplainsMarketAnalysis-Visual Analysis
- StockCharts.com
- Technical Analysis of the Financial Markets
- The Visual Investor
- VectorVest, Inc.
- Executive Premier Workshop
- One-Day Options Course
- OptionsPro
- Retirement Income Workshop
- Sure-Fire Trading Systems (VectorVest, Inc.)
- Trading as a Business Workshop
- VectorVest 7 EOD
- VectorVest 7 RealTime/IntraDay
- VectorVest AutoTester
- VectorVest Educational Services
- VectorVest OnLine
- VectorVest Options Analyzer
- VectorVest ProGraphics v6.0
- VectorVest ProTrader 7
- VectorVest RealTime Derby Tool
- VectorVest Simulator
- VectorVest Variator
- VectorVest Watchdog
