HOT TOPICS LIST
- MACD
- Fibonacci
- RSI
- Gann
- ADXR
- Stochastics
- Volume
- Triangles
- Futures
- Cycles
- Volatility
- ZIGZAG
- MESA
- Retracement
- Aroon
INDICATORS LIST
LIST OF TOPICS
PRINT THIS ARTICLE
by Koos van der Merwe
The maxim "Trade what you see, not what you think you see" applies to all charts, but sometimes pure common sense carries greater weight.
Position: N/A
Koos van der Merwe
Has been a technical analyst since 1969, and has worked as a futures and options trader with First Financial Futures in Johannesburg, South Africa.
PRINT THIS ARTICLE
TECHNICAL INDICATORS
Go With The Flow
05/14/07 08:50:09 AMby Koos van der Merwe
The maxim "Trade what you see, not what you think you see" applies to all charts, but sometimes pure common sense carries greater weight.
Position: N/A
| The Economist (April 28, 2007) has an article titled "Buttonwood: Sale of the Century." In the article the writer suggests that the reason for the Dow Jones Industrial Average's recent strength is that companies are buying back their own shares at a record rate, and investors are then lured into buying shares of those companies regardless. If this is true — and there is no reason to doubt it — we must question why. Why are companies buying their own shares rather than using their surplus cash — profits — to expand and grow their companies, or for that matter, increase the dividends distributed to their shareholders? We can also ask where is the money coming from, increased sales or reduced expenditure? |
| If companies are buying their own shares, why then are pundits seeing a recession in the US on the horizon? And therein lays the answer: The fear of a recession in the United States. Personally, I believe that Ben Bernanke, the chairman of the US Federal Reserve, is a great deal smarter than most people believe him to be. I believe he is allowing the US dollar to weaken dramatically, and will continue to do so for a few years to come, or until such time as the US deficit (money that was borrowed with a strong dollar) is repaid with a far weaker dollar. This makes common sense, and brings me to my first chart, the US Dollar Index ($UDX). |

|
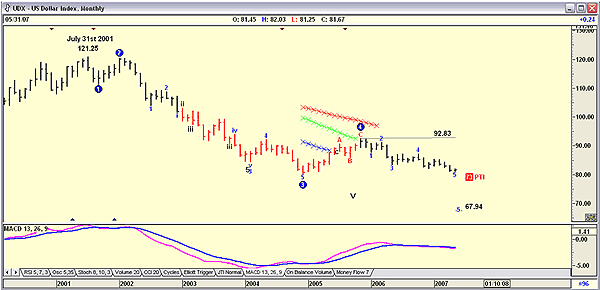
| FIGURE 1: US DOLLAR, MONTHLY. Here's a drop in the US dollar, and the further slide expected. |
| Graphic provided by: AdvancedGET. |
| |
| Figure 1 is a monthly chart of the US Dollar Index, which shows how the index collapsed from a high of 121.25 on July 31, 2001, to its present level of 81.67, a fall of 32.64% ((121.25 - 81.67)/121.25). Wait... lights are flashing; 32.6% is not close to a Fibonacci number, a number not to be ignored. Does this not suggest that the dollar could have bottomed and is now going to strengthen? This scenario does look probable. A look at the chart does show what could be a double bottom, but this will only be confirmed should the index start moving up and break the 92.83 level. The moving average convergence/divergence (MACD) indicator is still weak, and the wave analysis suggested by the program, Advanced GET, is suggesting the possibility of a fifth wave down move as a 73% (73 PTI) probability to a target of 67.94. This leads me to Figure 2. |

|
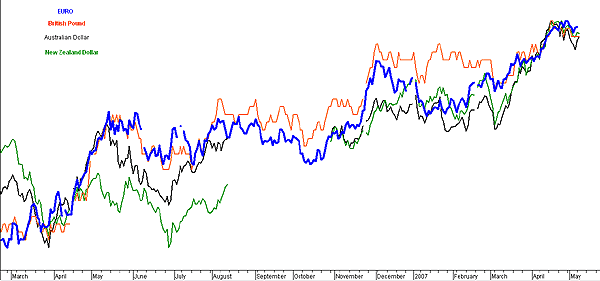
| FIGURE 2: EURO, POUND, AUSSIE DOLLAR, KIWI DOLLAR. This chart shows how certain currencies have moved in sync. |
| Graphic provided by: MetaStock. |
| |
| Figure 2 is a consolidated chart of the euro, British pound, Australian dollar, and New Zealand dollar. I have not included the yen or yuan. You can see that all the currencies chosen are floating and have strengthened against the dollar. This means that merchandise manufactured in these countries have become more expensive to the consumer in the United States and vice versa. However, my next chart of the yen against the euro, Figure 3, tells a different story. |

|
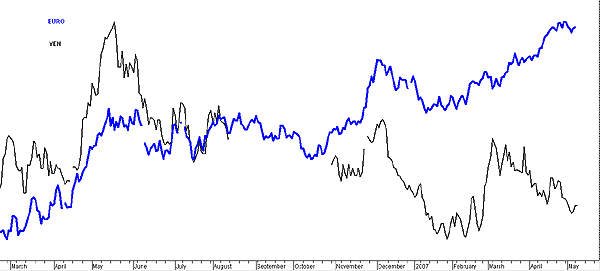
| FIGURE 3: YEN VS. EURO. Here's how the yen has moved against the US dollar as compared to the movement of the euro. |
| Graphic provided by: MetaStock. |
| |
| And then, of course, there is the yuan (renmimbi), not shown on the chart. We all know that the yuan is fixed to the US dollar, adjusted as and when? This is a bone of contention for the United States, which complains that Chinese merchandise is far too cheap. The yen, on the other hand, when compared to the euro, started off tracking the US dollar, but appears to have started leaning more toward the yuan/US dollar from about October 2006. So if the US dollar is "Dead... dead... dead," to quote Peter Grandich from his May 7th Grandich newsletter, where do you as an investor place your money? You may say GOLD, or any other metal out there, for that matter. Molybdenum is becoming the current flavor, and uranium, well, need I say more? Then, of course, you could look for those US companies buying back their own shares, and you could go with the flow. |
Has been a technical analyst since 1969, and has worked as a futures and options trader with First Financial Futures in Johannesburg, South Africa.
| Address: | 3256 West 24th Ave |
| Vancouver, BC | |
| Phone # for sales: | 6042634214 |
| E-mail address: | petroosp@gmail.com |
Click here for more information about our publications!
PRINT THIS ARTICLE

Request Information From Our Sponsors
- StockCharts.com, Inc.
- Candle Patterns
- Candlestick Charting Explained
- Intermarket Technical Analysis
- John Murphy on Chart Analysis
- John Murphy's Chart Pattern Recognition
- John Murphy's Market Message
- MurphyExplainsMarketAnalysis-Intermarket Analysis
- MurphyExplainsMarketAnalysis-Visual Analysis
- StockCharts.com
- Technical Analysis of the Financial Markets
- The Visual Investor
- VectorVest, Inc.
- Executive Premier Workshop
- One-Day Options Course
- OptionsPro
- Retirement Income Workshop
- Sure-Fire Trading Systems (VectorVest, Inc.)
- Trading as a Business Workshop
- VectorVest 7 EOD
- VectorVest 7 RealTime/IntraDay
- VectorVest AutoTester
- VectorVest Educational Services
- VectorVest OnLine
- VectorVest Options Analyzer
- VectorVest ProGraphics v6.0
- VectorVest ProTrader 7
- VectorVest RealTime Derby Tool
- VectorVest Simulator
- VectorVest Variator
- VectorVest Watchdog
