HOT TOPICS LIST
- MACD
- Fibonacci
- RSI
- Gann
- ADXR
- Stochastics
- Volume
- Triangles
- Futures
- Cycles
- Volatility
- ZIGZAG
- MESA
- Retracement
- Aroon
INDICATORS LIST
LIST OF TOPICS
PRINT THIS ARTICLE
by Chaitali Mohile
The possibility of long consolidation remains in Microchip Technology, while the stochastic is overbought but flat, so bulls sustain the rally.
Position: N/A
Chaitali Mohile
Active trader in the Indian stock markets since 2003 and a full-time writer. Trading is largely based upon technical analysis.
PRINT THIS ARTICLE
STOCHASTICS
Bullish Consolidation In Microchip Technology
05/15/07 03:32:43 PMby Chaitali Mohile
The possibility of long consolidation remains in Microchip Technology, while the stochastic is overbought but flat, so bulls sustain the rally.
Position: N/A
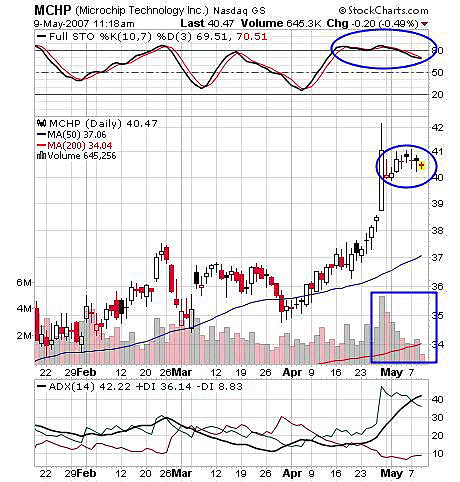
| The stochastic used to analyze MCHP is 10,7,3. Figure 1, the daily chart, shows Microchip Technology (MCHP) forming a base over the last few months. The stochastic (10,7,3) was overbought during this period but could not sustain that pace. The price then surged above its congestion simultaneously with the stochastic. Expanding volume added strength to this new bullish rally. The stochastic turned overbought and remained flat. |

|
| FIGURE 1: MCHP, DAILY. The flat stochastic indicates some more consolidation before the next bullish rally. |
| Graphic provided by: StockCharts.com. |
| |
| The price rallied from $38 to $42 on an overbought but flat stochastic. The marked circle on the candlestick indicated the congestion of price. Various doji candles are formed, indicating indecision. But during this consolidation phase the price has established support around $40, confirming the ongoing bullish rally. The stochastic declined below 80 but is still overbought. The average directional movement index (ADX)(14) is considered overheated above 40. Figure 1 shows the ADX (14) 42 that is marginally overheated. Still, the ADX is not alarming but cannot be ignored. |

|
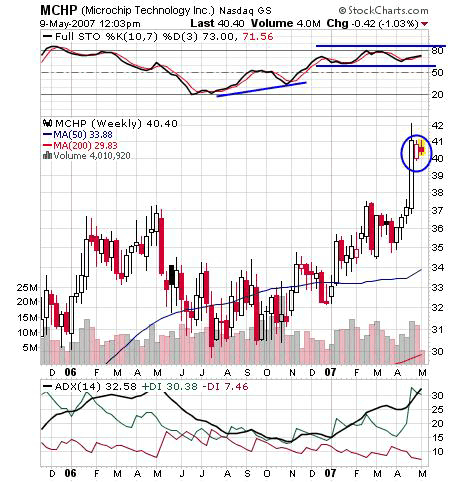
| FIGURE 2: MCHP, WEEKLY. The flag & pennant continuation pattern is yet to complete. The breakout of the formation and stochastic rangebound level will create a buying opportunity. |
| Graphic provided by: StockCharts.com. |
| |
| Figure 2, the weekly chart, shows the stochastic moving in the range of 70-80 since December 2006. This oscillator still has some more room to stay bullish on the rally. Traders should note that a higher low made on the oscillator in 2006 is one of the bullish indications of a bullish rally. The flag & pennant formation is being formed. This formation is a continuation pattern, which shows the consolidation after the advance rally. The stock does not give any buy signals, so traders need to just watch the price movement and the breakout of the flag & pennant pattern. |
| The flat stochastic -- doji candles -- the overheated ADX -- and the flag & pennant formation. These are some highlights of both charts. Together, they point to some continuing consolidation. Traders can thus wait for the breakout and stochastic buy signal before entering any long positions. |
Active trader in the Indian stock markets since 2003 and a full-time writer. Trading is largely based upon technical analysis.
| Company: | Independent |
| Address: | C1/3 Parth Indraprasth Towers. Vastrapur |
| Ahmedabad, Guj 380015 | |
| E-mail address: | chaitalimohile@yahoo.co.in |
Traders' Resource Links | |
| Independent has not added any product or service information to TRADERS' RESOURCE. | |
Click here for more information about our publications!
PRINT THIS ARTICLE

Request Information From Our Sponsors
- StockCharts.com, Inc.
- Candle Patterns
- Candlestick Charting Explained
- Intermarket Technical Analysis
- John Murphy on Chart Analysis
- John Murphy's Chart Pattern Recognition
- John Murphy's Market Message
- MurphyExplainsMarketAnalysis-Intermarket Analysis
- MurphyExplainsMarketAnalysis-Visual Analysis
- StockCharts.com
- Technical Analysis of the Financial Markets
- The Visual Investor
- VectorVest, Inc.
- Executive Premier Workshop
- One-Day Options Course
- OptionsPro
- Retirement Income Workshop
- Sure-Fire Trading Systems (VectorVest, Inc.)
- Trading as a Business Workshop
- VectorVest 7 EOD
- VectorVest 7 RealTime/IntraDay
- VectorVest AutoTester
- VectorVest Educational Services
- VectorVest OnLine
- VectorVest Options Analyzer
- VectorVest ProGraphics v6.0
- VectorVest ProTrader 7
- VectorVest RealTime Derby Tool
- VectorVest Simulator
- VectorVest Variator
- VectorVest Watchdog
