HOT TOPICS LIST
- MACD
- Fibonacci
- RSI
- Gann
- ADXR
- Stochastics
- Volume
- Triangles
- Futures
- Cycles
- Volatility
- ZIGZAG
- MESA
- Retracement
- Aroon
INDICATORS LIST
LIST OF TOPICS
PRINT THIS ARTICLE
by David Penn
Relative strength and moving averages suggest that the mighty U.S. dollar may be on the verge of sinking.
Position: N/A
David Penn
Technical Writer for Technical Analysis of STOCKS & COMMODITIES magazine, Working-Money.com, and Traders.com Advantage.
PRINT THIS ARTICLE
WILDER'S RSI
The Dollar and the Deep Blue Sea
12/06/00 01:34:56 PMby David Penn
Relative strength and moving averages suggest that the mighty U.S. dollar may be on the verge of sinking.
Position: N/A
| What was once heresy is now, albeit reluctantly, common conversation as the twin inevitabilities of a George W. Bush presidency and a slowing U.S. economy converge. While it may be too soon to begin talking about "the Bush Recession", it does seem like a good time to take a look at the near-term fate of the U.S. dollar. If the nations of the world see the strong dollar as one of a number of reasons to continue investing in the United States, then how might the world's financiers react to a slowdown-weakened dollar (to say nothing of a dollar swimming upstream against a recession)? |
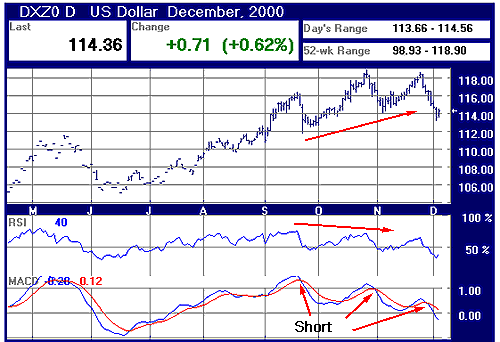
| The U.S. dollar has made three peaks this autumn, one each in September (at 116), October (at 118.50), and November (also at 118.50). The September peak was corrected by less than 3% before rallying, the October peak by just under 4% before rallying, and the November peak seems to have been corrected by about 4%. In all, relatively minor corrections, given the highs the dollar has seen this year. But technically speaking, the dollar seems to be telling another story, one in which peaks that appear to be successively higher turn out to be successively lower, and higher troughs between those peaks that are undermined by downtrending moving averages and strong short signals from the moving average convergence divergence oscillator (MACD). |

|
| Bearish divergence between price action and the relative strength index may anticipate a softening in U.S. dollar futures. |
| Graphic provided by: FutureSource.com. |
| |
| The role of the relative strength index (RSI) is to determine a relationship between the numbers of positive, "market up", and negative, "market down", days over a given period of time. Generally used to gauge overbought and oversold levels, the RSI can also be effective in confirming major moves in price action. By comparing peaks and troughs in price action to corresponding peaks and troughs in the relative strength index, technical analysts can evaluate, for example, whether a series of new highs in price action is sustainable or whether a reversal is likely. |
| Here, the RSI clearly reveals the September-October-November series of peaks as a successively LOWER series of peaks, which suggests that the U.S. dollar's recent run of new highs may be coming to an end. Given the fact that the November peak in price action is barely higher than the October peak (and its correction was deeper, albeit marginally), the price action of the dollar itself may be hinting at reversal. |
| Additionally, the moving average convergence divergence (MACD) indicator provides further bearish suggestions. The MACD is a combination indicator, helping elucidate price action as both a trend follower and an oscillator. Again, comparing the autumn price action peaks to the movement of the indicator, we discover bearish divergences. The moving averages of the MACD (29- and 12-day) are in a clear downward trend as of September, a trend emphasized in particular by the movement of the shorter 12-day moving average. Interestingly, even though the dollar has been advancing through August, the short signals in the MACD (signals to sell using the MACD occur when the shorter-duration moving average moves sharply beneath the longer-duration moving average) in mid-September and at the beginning of November are fairly convincing. |
Technical Writer for Technical Analysis of STOCKS & COMMODITIES magazine, Working-Money.com, and Traders.com Advantage.
| Title: | Technical Writer |
| Company: | Technical Analysis, Inc. |
| Address: | 4757 California Avenue SW |
| Seattle, WA 98116 | |
| Phone # for sales: | 206 938 0570 |
| Fax: | 206 938 1307 |
| Website: | www.Traders.com |
| E-mail address: | DPenn@traders.com |
Traders' Resource Links | |
| Charting the Stock Market: The Wyckoff Method -- Books | |
| Working-Money.com -- Online Trading Services | |
| Traders.com Advantage -- Online Trading Services | |
| Technical Analysis of Stocks & Commodities -- Publications and Newsletters | |
| Working Money, at Working-Money.com -- Publications and Newsletters | |
| Traders.com Advantage -- Publications and Newsletters | |
| Professional Traders Starter Kit -- Software | |
Click here for more information about our publications!
Comments
Date: / /Rank: 5Comment:
Date: 06/26/02Rank: 5Comment:

Request Information From Our Sponsors
- StockCharts.com, Inc.
- Candle Patterns
- Candlestick Charting Explained
- Intermarket Technical Analysis
- John Murphy on Chart Analysis
- John Murphy's Chart Pattern Recognition
- John Murphy's Market Message
- MurphyExplainsMarketAnalysis-Intermarket Analysis
- MurphyExplainsMarketAnalysis-Visual Analysis
- StockCharts.com
- Technical Analysis of the Financial Markets
- The Visual Investor
- VectorVest, Inc.
- Executive Premier Workshop
- One-Day Options Course
- OptionsPro
- Retirement Income Workshop
- Sure-Fire Trading Systems (VectorVest, Inc.)
- Trading as a Business Workshop
- VectorVest 7 EOD
- VectorVest 7 RealTime/IntraDay
- VectorVest AutoTester
- VectorVest Educational Services
- VectorVest OnLine
- VectorVest Options Analyzer
- VectorVest ProGraphics v6.0
- VectorVest ProTrader 7
- VectorVest RealTime Derby Tool
- VectorVest Simulator
- VectorVest Variator
- VectorVest Watchdog
