

HOT TOPICS LIST
- MACD
- Fibonacci
- RSI
- Gann
- ADXR
- Stochastics
- Volume
- Triangles
- Futures
- Cycles
- Volatility
- ZIGZAG
- MESA
- Retracement
- Aroon
INDICATORS LIST
LIST OF TOPICS
PRINT THIS ARTICLE
by Arthur Hill
After forming a large base over the last two and a half years, Eli Lilly & Co. surged to resistance on expanding volume. A breakout would be long-term bullish.
Position: Accumulate
Arthur Hill
Arthur Hill is currently editor of TDTrader.com, a website specializing in trading strategies, sector/industry specific breadth stats and overall technical analysis. He passed the Society of Technical Analysts (STA London) diploma exam with distinction is a Certified Financial Technician (CFTe). Prior to TD Trader, he was the Chief Technical Analyst for Stockcharts.com and the main contributor to the ChartSchool.
PRINT THIS ARTICLE
ACCUM./DIST. CHAIKIN
A Massive Base For Eli Lilly
05/08/07 08:51:11 AMby Arthur Hill
After forming a large base over the last two and a half years, Eli Lilly & Co. surged to resistance on expanding volume. A breakout would be long-term bullish.
Position: Accumulate
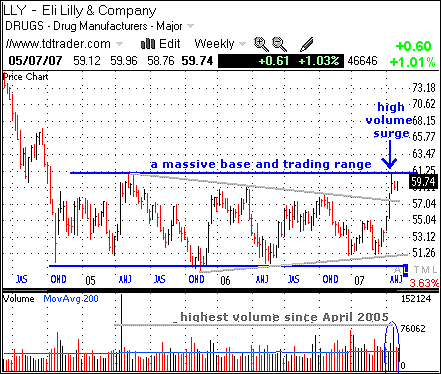
| On the weekly chart (Figure 1), the base extends from October 2004 until May 2007. The pattern is one big consolidation or rectangle, and trading has been confined to a 12-point range the entire time. There is a supply overhang around 60–61, and demand has not been strong enough to punch through this level. A break through this resistance would forge a 52-week high and signal renewed confidence. |
|
| FIGURE 1: ELI LILLY, WEEKLY. The base extends from October 2004 to May 2007. The pattern is one big consolidation or rectangle, and trading has been confined to a 12-point range the entire time. |
| Graphic provided by: Telechart 2007. |
| |
| Upon a breakout, the upside target would be around 75. The height of the pattern is added to the breakout point for projection measurement. The pattern measures 11.50 points, and a breakout at 61 would project a move to around 72.50. In addition, the December 2003 to June 2004 highs mark resistance around 73–77. Taken together, the advance could extend to the 72.5–77 area, or a midpoint at 74.75. |
| The high-volume surge off support increases the chances of a breakout. Eli Lilly & Co. (LLY) moved from support to resistance in April with the highest volume of the year. The weekly volume total was the highest since April 2005. The April 2005 surge failed at the top of the resistance zone, so this is not the first convincing attempt for a breakout. |
|
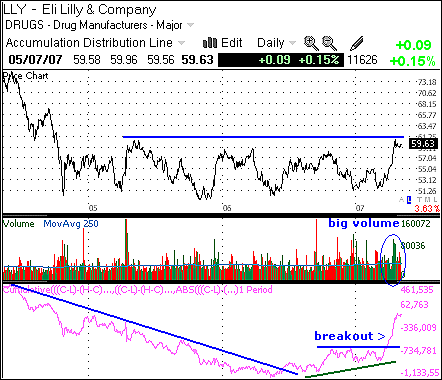
| FIGURE 2: ELI LILLY, DAILY. The accumulation-distribution line measures buying pressure against price action. The price plot is black and the A-D line is magenta. |
| Graphic provided by: Telechart 2007. |
| |
| I have also applied the accumulation-distribution line to measure buying pressure against price action (Figure 2). The price plot is black and the accumulation-distribution line is magenta. The indicator formed a higher low earlier this year (positive divergence, green line) and broke to multiyear highs in April. This further confirms strong buying pressure and increases the chances of prices following suit. |
Arthur Hill is currently editor of TDTrader.com, a website specializing in trading strategies, sector/industry specific breadth stats and overall technical analysis. He passed the Society of Technical Analysts (STA London) diploma exam with distinction is a Certified Financial Technician (CFTe). Prior to TD Trader, he was the Chief Technical Analyst for Stockcharts.com and the main contributor to the ChartSchool.
| Title: | Editor |
| Company: | TDTrader.com |
| Address: | Willem Geetsstraat 17 |
| Mechelen, B2800 | |
| Phone # for sales: | 3215345465 |
| Website: | www.tdtrader.com |
| E-mail address: | arthurh@tdtrader.com |
Traders' Resource Links | |
| TDTrader.com has not added any product or service information to TRADERS' RESOURCE. | |
Click here for more information about our publications!
Comments
Date:�05/08/07Rank:�4Comment:�

Request Information From Our Sponsors
- StockCharts.com, Inc.
- Candle Patterns
- Candlestick Charting Explained
- Intermarket Technical Analysis
- John Murphy on Chart Analysis
- John Murphy's Chart Pattern Recognition
- John Murphy's Market Message
- MurphyExplainsMarketAnalysis-Intermarket Analysis
- MurphyExplainsMarketAnalysis-Visual Analysis
- StockCharts.com
- Technical Analysis of the Financial Markets
- The Visual Investor
- VectorVest, Inc.
- Executive Premier Workshop
- One-Day Options Course
- OptionsPro
- Retirement Income Workshop
- Sure-Fire Trading Systems (VectorVest, Inc.)
- Trading as a Business Workshop
- VectorVest 7 EOD
- VectorVest 7 RealTime/IntraDay
- VectorVest AutoTester
- VectorVest Educational Services
- VectorVest OnLine
- VectorVest Options Analyzer
- VectorVest ProGraphics v6.0
- VectorVest ProTrader 7
- VectorVest RealTime Derby Tool
- VectorVest Simulator
- VectorVest Variator
- VectorVest Watchdog