HOT TOPICS LIST
- MACD
- Fibonacci
- RSI
- Gann
- ADXR
- Stochastics
- Volume
- Triangles
- Futures
- Cycles
- Volatility
- ZIGZAG
- MESA
- Retracement
- Aroon
INDICATORS LIST
LIST OF TOPICS
PRINT THIS ARTICLE
by Chaitali Mohile
Having formed an ascending triangle, Hewlett-Packard is now ready to break out.
Position: Buy
Chaitali Mohile
Active trader in the Indian stock markets since 2003 and a full-time writer. Trading is largely based upon technical analysis.
PRINT THIS ARTICLE
ASCENDING TRIANGLES
Move Begins In Hewlett-Packard
05/09/07 11:28:12 AMby Chaitali Mohile
Having formed an ascending triangle, Hewlett-Packard is now ready to break out.
Position: Buy
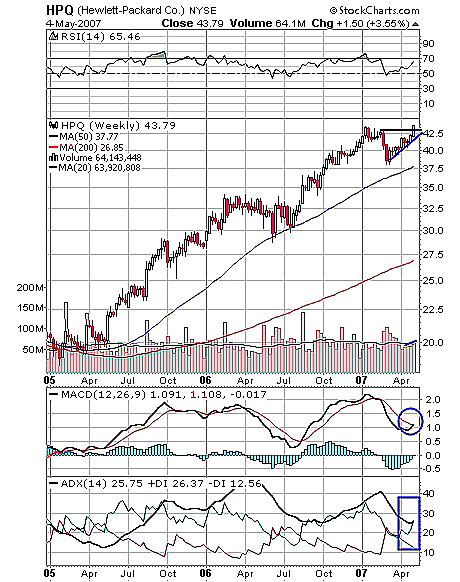
| Hewlett-Packard in Figure 1 has formed an ascending triangle, showing some price congestion at $42.50 with an overbought relative strength index (RSI) (14) above 70. The price retraced to $37.50. But being in a strong uptrend and a bullish rally, the stock reached its previous high of $42.50 with an above-margin volume. |
| The RSI (14) shows bullish strength. The indicator hasn't moved below its 50 mark ever. The moving average convergence/divergence (MACD) indicates the possibility of a bullish crossover. In Figure 1, the average directional movement index (ADX)(14) confirms the strong uptrend of the stock. At 25, the +DI (positive directional index) is ready to cross the ADX upward. So the breakout will give a buying opportunity to traders. |

|
| FIGURE 1: HPQ, WEEKLY. Hewlett-Packard formed an ascending triangle, showing some price congestion at $42.50 with an overbought RSI(14) above 70. |
| Graphic provided by: StockCharts.com. |
| |
| I would recommend traders to go long on breakout at $42.50 with a target of $47.50. The breakout level on the ascending triangle is calculated on the length of the triangle; $42.50 - $37.50 = $5 is the length of triangle. So by adding $5 to $42.50, traders can see the target. |

|
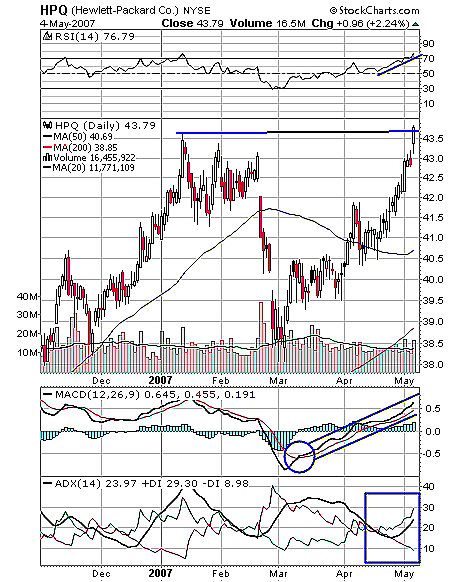
| FIGURE 2: HPQ, DAILY. The trend is developing at the 23 level, so the breakout of a previous high pivot will make the trend stronger. |
| Graphic provided by: StockCharts.com. |
| |
| According to Figure 2, the stock closed above its previous high resistance. This is one of the bullish indicators. Figure 2 also shows the good volume flow in the stock. The RSI (14) moved vertically above 70 as the price traveled above $43, so the weekly target can be followed, confident with the view of violating the previous high resistance in the daily chart. The MACD (12, 26, 9) with a bullish crossover has remained above its trigger line, reflecting a buy signal. The ADX (14) turned upward from its 15 level, indicating the bullish strength in the trend. The trend is developing at the 23 level, so the breakout of a previous high pivot will make the trend stronger. |
| The ascending triangle breakout creates low-risk buying opportunities, and hence, the breakout of Hewlett-Packard should be bought with the target of $42.50. |
Active trader in the Indian stock markets since 2003 and a full-time writer. Trading is largely based upon technical analysis.
| Company: | Independent |
| Address: | C1/3 Parth Indraprasth Towers. Vastrapur |
| Ahmedabad, Guj 380015 | |
| E-mail address: | chaitalimohile@yahoo.co.in |
Traders' Resource Links | |
| Independent has not added any product or service information to TRADERS' RESOURCE. | |
Click here for more information about our publications!
PRINT THIS ARTICLE

Request Information From Our Sponsors
- VectorVest, Inc.
- Executive Premier Workshop
- One-Day Options Course
- OptionsPro
- Retirement Income Workshop
- Sure-Fire Trading Systems (VectorVest, Inc.)
- Trading as a Business Workshop
- VectorVest 7 EOD
- VectorVest 7 RealTime/IntraDay
- VectorVest AutoTester
- VectorVest Educational Services
- VectorVest OnLine
- VectorVest Options Analyzer
- VectorVest ProGraphics v6.0
- VectorVest ProTrader 7
- VectorVest RealTime Derby Tool
- VectorVest Simulator
- VectorVest Variator
- VectorVest Watchdog
- StockCharts.com, Inc.
- Candle Patterns
- Candlestick Charting Explained
- Intermarket Technical Analysis
- John Murphy on Chart Analysis
- John Murphy's Chart Pattern Recognition
- John Murphy's Market Message
- MurphyExplainsMarketAnalysis-Intermarket Analysis
- MurphyExplainsMarketAnalysis-Visual Analysis
- StockCharts.com
- Technical Analysis of the Financial Markets
- The Visual Investor
