HOT TOPICS LIST
- MACD
- Fibonacci
- RSI
- Gann
- ADXR
- Stochastics
- Volume
- Triangles
- Futures
- Cycles
- Volatility
- ZIGZAG
- MESA
- Retracement
- Aroon
INDICATORS LIST
LIST OF TOPICS
PRINT THIS ARTICLE
by David Penn
After slipping into a sideways consolidation in the autumn of 2006, semiconductor stocks broke out in the spring of 2007.
Position: N/A
David Penn
Technical Writer for Technical Analysis of STOCKS & COMMODITIES magazine, Working-Money.com, and Traders.com Advantage.
PRINT THIS ARTICLE
BREAKOUTS
Semiconductors Break Out
05/07/07 03:29:08 PMby David Penn
After slipping into a sideways consolidation in the autumn of 2006, semiconductor stocks broke out in the spring of 2007.
Position: N/A
| Seasonally speaking, semiconductors tend to outperform from October to December — at least per the research of Yale and Jeff Hirsch in their Stock Traders Almanac. I've heard this notion of semiconductor seasonality before, most recently from Jim Cramer of Mad Money fame, who quipped, "Avoid chip stocks during the summer." |

|
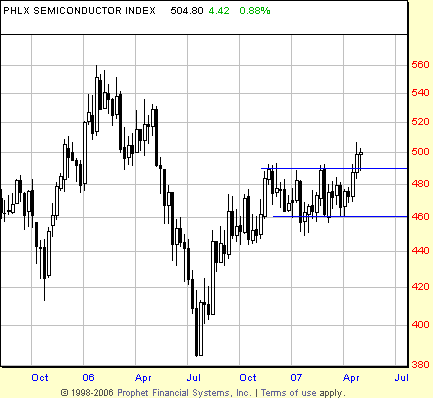
| FIGURE 1: PHILADELPHIA SEMICONDUCTOR INDEX, WEEKLY. The consolidation in the $SOX developed after a strong rally from the summer 2006 lows. Insofar as consolidations in trends tend to lead to more trend, the breakout to the upside in the spring of 2007 was little surprise. |
| Graphic provided by: Prophet Financial, Inc. |
| |
| Much recent action in the semiconductor indexes and proxies ($SOX and SMH, respectively) seems to support these opinions. In 2004, the SMH (semiconductor HOLDRS) bottomed in August near 28 and by late November were trading north of 34. In 2005, the SMH bottomed in October near 33 and by the first week of January the following year was trading as high as 40. |
| The year 2006 saw another summer bottom in semiconductor stocks in mid-July near 29 produce a strong rally into October (the SMH topped near 36). But from October to December there was little if any appreciation for semiconductor stocks. Instead, semiconductor stocks moved sideways for week after week throughout the first quarter of 2007 and into the second. |

|
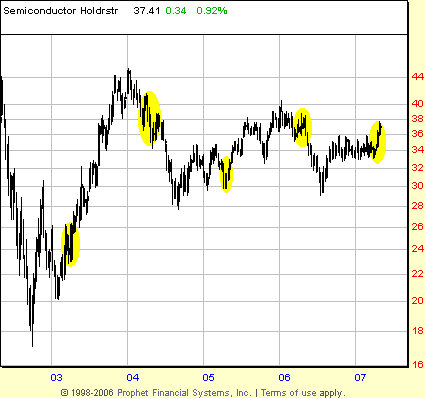
| FIGURE 2: SEMICONDUCTOR HOLDRS TRUST, WEEKLY. Alternating Aprils have proved timely buying and selling opportunities for semiconductor stocks over the past few years. As such, the April of 2007 is scheduled to be a buying opportunity. |
| Graphic provided by: Prophet Financial, Inc. |
| |
| April has brought alternating fortunes to semiconductor stocks over the past few years. The spring of 2004 was a selling opportunity. The spring of 2005 proved to be an apt time to buy. The spring of 2006 was once again a time to sell. And so it is that the spring of 2007 seems to present another opportunity for speculators to purchase semiconductor stocks at consolidation or depressed prices (see Figures 1 and 2). |
| The width of the consolidation in the SMH — approximately three points from 33 to 36 — suggests an upside minimum move to the 39 area. As for the $SOX, a 30-point wide consolidation between, roughly, 460 and 490 projects an upside to 520. In both the SMH and the $SOX, these upside projections point to a test of the April highs from 2006 initially (approximately 39 and 535, respectively) and beyond that, perhaps a run at the 2006 highs (approximately 40.5 and 560) as well. |
Technical Writer for Technical Analysis of STOCKS & COMMODITIES magazine, Working-Money.com, and Traders.com Advantage.
| Title: | Technical Writer |
| Company: | Technical Analysis, Inc. |
| Address: | 4757 California Avenue SW |
| Seattle, WA 98116 | |
| Phone # for sales: | 206 938 0570 |
| Fax: | 206 938 1307 |
| Website: | www.Traders.com |
| E-mail address: | DPenn@traders.com |
Traders' Resource Links | |
| Charting the Stock Market: The Wyckoff Method -- Books | |
| Working-Money.com -- Online Trading Services | |
| Traders.com Advantage -- Online Trading Services | |
| Technical Analysis of Stocks & Commodities -- Publications and Newsletters | |
| Working Money, at Working-Money.com -- Publications and Newsletters | |
| Traders.com Advantage -- Publications and Newsletters | |
| Professional Traders Starter Kit -- Software | |
Click here for more information about our publications!
Comments
Date: 05/07/07Rank: 2Comment:

Request Information From Our Sponsors
- StockCharts.com, Inc.
- Candle Patterns
- Candlestick Charting Explained
- Intermarket Technical Analysis
- John Murphy on Chart Analysis
- John Murphy's Chart Pattern Recognition
- John Murphy's Market Message
- MurphyExplainsMarketAnalysis-Intermarket Analysis
- MurphyExplainsMarketAnalysis-Visual Analysis
- StockCharts.com
- Technical Analysis of the Financial Markets
- The Visual Investor
- VectorVest, Inc.
- Executive Premier Workshop
- One-Day Options Course
- OptionsPro
- Retirement Income Workshop
- Sure-Fire Trading Systems (VectorVest, Inc.)
- Trading as a Business Workshop
- VectorVest 7 EOD
- VectorVest 7 RealTime/IntraDay
- VectorVest AutoTester
- VectorVest Educational Services
- VectorVest OnLine
- VectorVest Options Analyzer
- VectorVest ProGraphics v6.0
- VectorVest ProTrader 7
- VectorVest RealTime Derby Tool
- VectorVest Simulator
- VectorVest Variator
- VectorVest Watchdog
