HOT TOPICS LIST
- MACD
- Fibonacci
- RSI
- Gann
- ADXR
- Stochastics
- Volume
- Triangles
- Futures
- Cycles
- Volatility
- ZIGZAG
- MESA
- Retracement
- Aroon
INDICATORS LIST
LIST OF TOPICS
PRINT THIS ARTICLE
by David Penn
How far will the bounce in housing stocks go?
Position: N/A
David Penn
Technical Writer for Technical Analysis of STOCKS & COMMODITIES magazine, Working-Money.com, and Traders.com Advantage.
PRINT THIS ARTICLE
RETRACEMENT
Measured Moves In Housing
05/07/07 02:51:51 PMby David Penn
How far will the bounce in housing stocks go?
Position: N/A
| I've written lately about measured move patterns for both Traders.com Advantage ("Measured Moves In The Swiss Franc," March 7, 2007) and Working-Money.com ("Measures And Half Measures," May 4, 2007). With markets across the board moving toward new highs, I went searching for markets that were taking advantage of market strength to rally from significant lows. Unsurprisingly, the housing market was one of the first places I looked. |

|
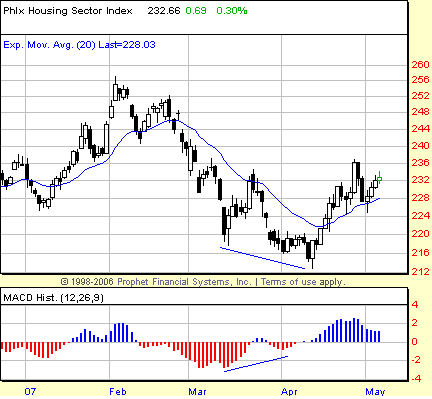
| FIGURE 1: PHILADELPHIA HOUSING SECTOR INDEX, DAILY. A month-on-month positive divergence in the MACD histogram signaled an end to the correction in housing stocks that began in February. |
| Graphic provided by: Prophet Financial, Inc. |
| |
| What I saw in the index of housing stocks (the Philadelphia Housing Sector Index, or $HGX) was a market that had topped in earliest February 2007, and corrected more than 15% before making a low in mid-April (Figure 1). This mid-April low was accompanied by a positive divergence in the moving average convergence/divergence (MACD) histogram, which helped identify the low as a significant bottom. The $HGX rallied over the balance of April, breaking back above the 20-day exponential moving average (EMA) and moving almost vertically by the end of the month. |
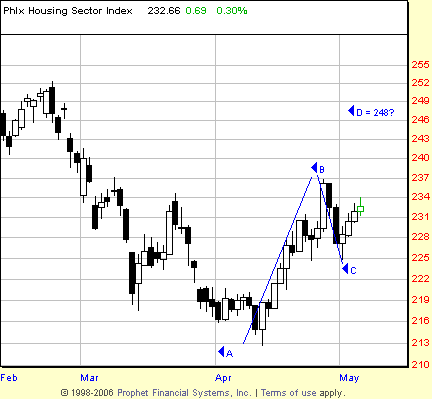
| Since that bounce, $HGX has retraced mildly to successfully test the 20-day EMA for support and is currently en route to taking out the April high just north of 235. (See Figure 2.) |
| Treating the bounce and successful test of the 20-day exponential moving average (EMA) as a potential ABCD pattern allows us to use the same sort of rules that can effectively project the upside (or downside, in the case of a breakdown) of a measured move. Here we have a point A (the April low) at 214, point B (the April high) at 237, and point C (the low of the 20-day EMA test) at 225. If the advance in $HGX is a successful ABCD/measured move pattern, then the market should rally to AB + C, the distance between points A and B added to the value at point C. This suggests an upside target near 248. |

|
| FIGURE 2: PHILADELPHIA HOUSING SECTOR INDEX, DAILY. As a measured move pattern, the rally from the April lows projects an upside to 248 if the $HGX can first clear the 1/2 AB + C point near the April highs. |
| Graphic provided by: Prophet Financial, Inc. |
| |
| As I note in "Measures And Half Measures," one strategy for determining whether the odds are good that a market will reach point D is whether or not the market can first reach a point halfway between C and D. This halfway point is the same as 1/2 D AB + C, and here is approximately 235. This level also represents the April high, so there is likely to be some measure of resistance as the market makes its test. But a strong move through the 235 level in the $HGX is likely to translate into higher highs for housing stocks in the near term. |
Technical Writer for Technical Analysis of STOCKS & COMMODITIES magazine, Working-Money.com, and Traders.com Advantage.
| Title: | Technical Writer |
| Company: | Technical Analysis, Inc. |
| Address: | 4757 California Avenue SW |
| Seattle, WA 98116 | |
| Phone # for sales: | 206 938 0570 |
| Fax: | 206 938 1307 |
| Website: | www.Traders.com |
| E-mail address: | DPenn@traders.com |
Traders' Resource Links | |
| Charting the Stock Market: The Wyckoff Method -- Books | |
| Working-Money.com -- Online Trading Services | |
| Traders.com Advantage -- Online Trading Services | |
| Technical Analysis of Stocks & Commodities -- Publications and Newsletters | |
| Working Money, at Working-Money.com -- Publications and Newsletters | |
| Traders.com Advantage -- Publications and Newsletters | |
| Professional Traders Starter Kit -- Software | |
Click here for more information about our publications!
Comments
Date: 05/07/07Rank: 2Comment:

Request Information From Our Sponsors
- StockCharts.com, Inc.
- Candle Patterns
- Candlestick Charting Explained
- Intermarket Technical Analysis
- John Murphy on Chart Analysis
- John Murphy's Chart Pattern Recognition
- John Murphy's Market Message
- MurphyExplainsMarketAnalysis-Intermarket Analysis
- MurphyExplainsMarketAnalysis-Visual Analysis
- StockCharts.com
- Technical Analysis of the Financial Markets
- The Visual Investor
- VectorVest, Inc.
- Executive Premier Workshop
- One-Day Options Course
- OptionsPro
- Retirement Income Workshop
- Sure-Fire Trading Systems (VectorVest, Inc.)
- Trading as a Business Workshop
- VectorVest 7 EOD
- VectorVest 7 RealTime/IntraDay
- VectorVest AutoTester
- VectorVest Educational Services
- VectorVest OnLine
- VectorVest Options Analyzer
- VectorVest ProGraphics v6.0
- VectorVest ProTrader 7
- VectorVest RealTime Derby Tool
- VectorVest Simulator
- VectorVest Variator
- VectorVest Watchdog
