HOT TOPICS LIST
- MACD
- Fibonacci
- RSI
- Gann
- ADXR
- Stochastics
- Volume
- Triangles
- Futures
- Cycles
- Volatility
- ZIGZAG
- MESA
- Retracement
- Aroon
INDICATORS LIST
LIST OF TOPICS
PRINT THIS ARTICLE
by David Penn
Daily charts in both live and feeder cattle suggest a pause in the commodities' bull runs.
Position: N/A
David Penn
Technical Writer for Technical Analysis of STOCKS & COMMODITIES magazine, Working-Money.com, and Traders.com Advantage.
PRINT THIS ARTICLE
REVERSAL
Cattle Turns The Corner
05/07/07 02:26:54 PMby David Penn
Daily charts in both live and feeder cattle suggest a pause in the commodities' bull runs.
Position: N/A
| Although their respective tops were one month apart, both live and feeder cattle appear to be undergoing a significant amount of selling pressure in the late spring of 2007. |
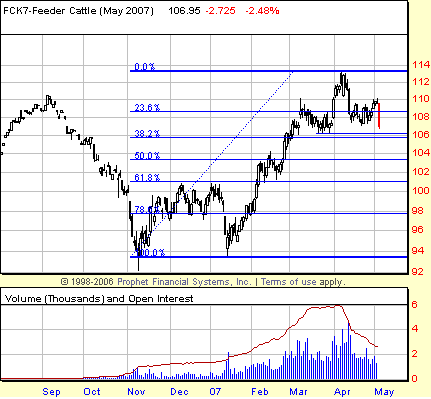
| Looking first at feeder cattle (basis May) (Figure 1), we see a market that bottomed in November 2006, tested that bottom in January 2007, and then rallied strongly over the next few months. Testing the November bottom with a low near 94, the May feeder cattle contract rallied to more than 112 by early April. Live cattle, by contrast, bottomed in April 2006, and rallied into September before pulling back to form a low in November. This low coincided with the bottom in feeder cattle. From the November low, live cattle resumed its ascent, climbing from 86 to 102 (basis continuous futures) by early March. |

|
| FIGURE 1: FEEDER CATTLE, MAY FUTURES, DAILY. A textbook head & shoulders top appears after an impressive rally in May feeder cattle. A successful breakdown below the 106 level projects to 90 and would mean taking out a number of potential support levels along the way. |
| Graphic provided by: Prophet Financial, Inc. |
| |
| The most significant technical development in the chart of feeder cattle is the recent breakdown in May, a breakdown that sets up the potential for a head & shoulders top in the May contract. This H&S pattern has its origins in March 2007 and measures from about 106 to 113. This suggests a minimum downside of about seven points, which would take May feeder cattle down past a number of potentially significant support levels. These support levels include the February highs north of 104, as well as the 61.8% Fibonacci retracement level at 101, and the highs from December 2006 and January 2007 just north of 100. |
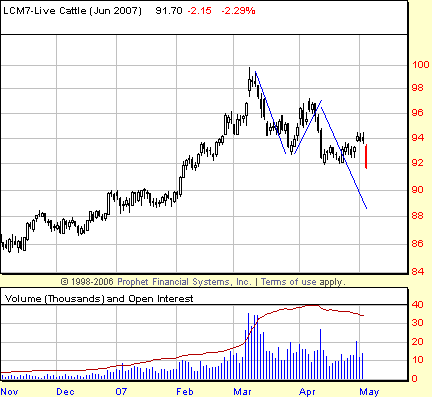
| In live cattle, the top has been marked by a saw-toothed correction pattern that saw lower lows in late March and mid-April (with the June contract very close to a new lower low in early May) and lower highs in early April and early May. This pattern is in and of itself bearish (lower lows and lower highs). It also resembles the opening legs of a potentially sharp, zigzag-style ABC correction. Although borrowed from the language of Elliott wave analysis, a zigzag-style correction can be thought of as a particularly sharp correction with relatively little retracement (that is, counter, countertrend) movement until the correction has run its course. As an example of this, "relatively little retracement" note that the second leg of the ABC correction rarely retraces more than a Fibonacci 61.8% of the initial leg. This was certainly the case with the late March–early April bounce in June live cattle, which fell just short of the 61.8% mark before moving lower into a lower low. |

|
| FIGURE 2: LIVE CATTLE, JUNE FUTURES, DAILY. The blue line traces out the likely path of a zigzag, ABC correction. Given the size of the initial leg down in March, it is likely that the correction in June live cattle will fall to the 90 level, at least. |
| Graphic provided by: Prophet Financial, Inc. |
| |
| If the correction in live cattle is taking the form of a zigzag, then it is likely that the current support at 92 is not likely to hold. The third leg of a zigzag — which appears to have begun in June live cattle in early April at about 97 — is typically longer than the first leg. That first leg — which saw June live cattle fall from 100 to about 93 over the course of March — measures approximately seven points. This suggests that the third leg of the correction will fall at least seven points to the 90 level. |
Technical Writer for Technical Analysis of STOCKS & COMMODITIES magazine, Working-Money.com, and Traders.com Advantage.
| Title: | Technical Writer |
| Company: | Technical Analysis, Inc. |
| Address: | 4757 California Avenue SW |
| Seattle, WA 98116 | |
| Phone # for sales: | 206 938 0570 |
| Fax: | 206 938 1307 |
| Website: | www.Traders.com |
| E-mail address: | DPenn@traders.com |
Traders' Resource Links | |
| Charting the Stock Market: The Wyckoff Method -- Books | |
| Working-Money.com -- Online Trading Services | |
| Traders.com Advantage -- Online Trading Services | |
| Technical Analysis of Stocks & Commodities -- Publications and Newsletters | |
| Working Money, at Working-Money.com -- Publications and Newsletters | |
| Traders.com Advantage -- Publications and Newsletters | |
| Professional Traders Starter Kit -- Software | |
Click here for more information about our publications!
Comments
Date: 05/07/07Rank: 1Comment:

Request Information From Our Sponsors
- VectorVest, Inc.
- Executive Premier Workshop
- One-Day Options Course
- OptionsPro
- Retirement Income Workshop
- Sure-Fire Trading Systems (VectorVest, Inc.)
- Trading as a Business Workshop
- VectorVest 7 EOD
- VectorVest 7 RealTime/IntraDay
- VectorVest AutoTester
- VectorVest Educational Services
- VectorVest OnLine
- VectorVest Options Analyzer
- VectorVest ProGraphics v6.0
- VectorVest ProTrader 7
- VectorVest RealTime Derby Tool
- VectorVest Simulator
- VectorVest Variator
- VectorVest Watchdog
- StockCharts.com, Inc.
- Candle Patterns
- Candlestick Charting Explained
- Intermarket Technical Analysis
- John Murphy on Chart Analysis
- John Murphy's Chart Pattern Recognition
- John Murphy's Market Message
- MurphyExplainsMarketAnalysis-Intermarket Analysis
- MurphyExplainsMarketAnalysis-Visual Analysis
- StockCharts.com
- Technical Analysis of the Financial Markets
- The Visual Investor
