HOT TOPICS LIST
- MACD
- Fibonacci
- RSI
- Gann
- ADXR
- Stochastics
- Volume
- Triangles
- Futures
- Cycles
- Volatility
- ZIGZAG
- MESA
- Retracement
- Aroon
INDICATORS LIST
LIST OF TOPICS
PRINT THIS ARTICLE
by David Penn
A failed breakout searches for support ... and another opportunity for a rally.
Position: N/A
David Penn
Technical Writer for Technical Analysis of STOCKS & COMMODITIES magazine, Working-Money.com, and Traders.com Advantage.
PRINT THIS ARTICLE
TRIANGLES
Coffee Comes In, Part 2
05/04/07 12:26:40 PMby David Penn
A failed breakout searches for support ... and another opportunity for a rally.
Position: N/A
| Consider this an update both to my previous article on coffee ("Coffee Comes In," January 5, 2007; Traders.com Advantage) as well as to Traders.com Advantage contributor Dominick Mazza's excellent, Elliott-wave based analysis ("Coffee Break?" November 22, 2006). Mazza's article made the case for higher prices in coffee futures by targeting a triangle pattern that extends from the high in early 2005 to the present. My article specifically referred to coffee's initial attempt to break free from that triangle pattern at the end of 2006. |
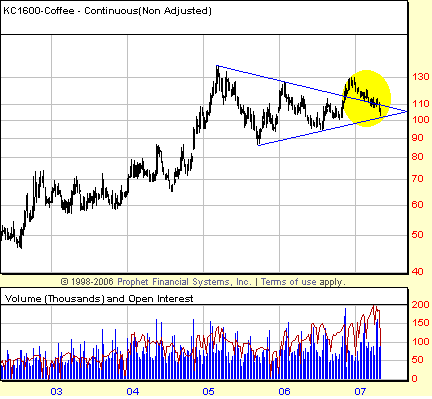
| The symmetrical triangle in coffee, approximately 50 cents wide at its widest point, projected a minimum upside target of about 165, given a breakout at about 115 (basis continuous futures) (Figure 1). The market did break out in mid-November 2006, but by mid-December, coffee's upward momentum appeared to peak out at the 130 level. As 2007 began, coffee prices were in retreat, first breaking down back below the upper boundary of the triangle and then moving lower toward the lower boundary. |

|
| FIGURE 1: COFFEE, CONTINUOUS FUTURES, WEEKLY. Coffee broke free from its symmetrical consolidation in late 2006, only to fall back into the consolidation in 2007 before reaching the upside minimum projection of 165. Should the lower boundary of the triangle provide support, then another attempt to rally could likely follow. |
| Graphic provided by: Prophet Financial, Inc. |
| |
| Often, when a breakout from a triangle begins to retrace, the upper boundary of the triangle provides enough support to stem the decline and give buyers another chance to bid the market back higher. However, when the upper boundary does not provide that support, it may be that the lower boundary of the triangle will instead provide the support necessary to keep the market up. The reverse is true for symmetrical triangle retracements in declining markets. A bounce back above the lower boundary of the triangle after a breakdown may still end up finding resistance at the upper boundary. |

|
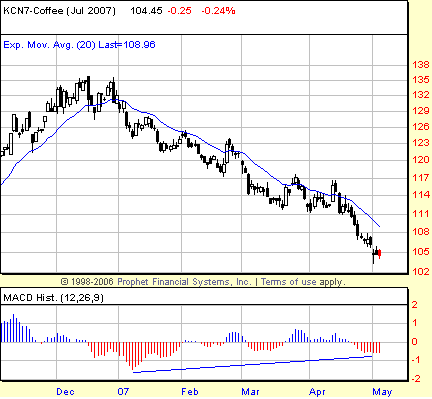
| FIGURE 2: COFFEE, JULY FUTURES, DAILY. The higher lows in the troughs of the MACD histogram over the course of 2007 provide some sense that momentum is waning to the downside in July coffee. But the trend is friend only to the bears at this point. |
| Graphic provided by: Prophet Financial, Inc. |
| |
| The lower boundary of the symmetrical triangle in the chart of continuous coffee futures is in effect also a trendline supporting coffee's advance from the summer of 2005 lows. Considered this way — that the lower boundary is both part of a chart pattern as well as a trendline in its own right — it is easy to see how the decline in coffee prices that began in 2007 could find support there. And doing so would be the first step in resuming the advance that back in the autumn of 2006 appeared destined to take coffee to 160 — or higher. |
| How does this translate into the near contract, the July contract? While the July contract does not reflect the triangle that the continuous contract does, the July contract has been in free-fall since the beginning of 2007. Negative divergences in the moving average convergence/divergence (MACD) histogram have developed enough to show that momentum to the downside is waning (Figure 2). But the collapse in coffee prices in 2007 — from 135 to 105 basis July — has been swift and severe enough to keep all but the bravest bulls at bay for the time being. |
Technical Writer for Technical Analysis of STOCKS & COMMODITIES magazine, Working-Money.com, and Traders.com Advantage.
| Title: | Technical Writer |
| Company: | Technical Analysis, Inc. |
| Address: | 4757 California Avenue SW |
| Seattle, WA 98116 | |
| Phone # for sales: | 206 938 0570 |
| Fax: | 206 938 1307 |
| Website: | www.Traders.com |
| E-mail address: | DPenn@traders.com |
Traders' Resource Links | |
| Charting the Stock Market: The Wyckoff Method -- Books | |
| Working-Money.com -- Online Trading Services | |
| Traders.com Advantage -- Online Trading Services | |
| Technical Analysis of Stocks & Commodities -- Publications and Newsletters | |
| Working Money, at Working-Money.com -- Publications and Newsletters | |
| Traders.com Advantage -- Publications and Newsletters | |
| Professional Traders Starter Kit -- Software | |
Click here for more information about our publications!
Comments
Date: 05/04/07Rank: 2Comment:

Request Information From Our Sponsors
- StockCharts.com, Inc.
- Candle Patterns
- Candlestick Charting Explained
- Intermarket Technical Analysis
- John Murphy on Chart Analysis
- John Murphy's Chart Pattern Recognition
- John Murphy's Market Message
- MurphyExplainsMarketAnalysis-Intermarket Analysis
- MurphyExplainsMarketAnalysis-Visual Analysis
- StockCharts.com
- Technical Analysis of the Financial Markets
- The Visual Investor
- VectorVest, Inc.
- Executive Premier Workshop
- One-Day Options Course
- OptionsPro
- Retirement Income Workshop
- Sure-Fire Trading Systems (VectorVest, Inc.)
- Trading as a Business Workshop
- VectorVest 7 EOD
- VectorVest 7 RealTime/IntraDay
- VectorVest AutoTester
- VectorVest Educational Services
- VectorVest OnLine
- VectorVest Options Analyzer
- VectorVest ProGraphics v6.0
- VectorVest ProTrader 7
- VectorVest RealTime Derby Tool
- VectorVest Simulator
- VectorVest Variator
- VectorVest Watchdog
