HOT TOPICS LIST
- MACD
- Fibonacci
- RSI
- Gann
- ADXR
- Stochastics
- Volume
- Triangles
- Futures
- Cycles
- Volatility
- ZIGZAG
- MESA
- Retracement
- Aroon
INDICATORS LIST
LIST OF TOPICS
PRINT THIS ARTICLE
by David Penn
Nearly 20 months in the making, a diamond top towers over the Dow Jones Industrial Average.
Position: N/A
David Penn
Technical Writer for Technical Analysis of STOCKS & COMMODITIES magazine, Working-Money.com, and Traders.com Advantage.
PRINT THIS ARTICLE
CHART ANALYSIS
The Dow's Diamond Top
12/04/00 02:02:00 PMby David Penn
Nearly 20 months in the making, a diamond top towers over the Dow Jones Industrial Average.
Position: N/A
| Perhaps the most spectacular scene in the movie blockbuster, INDEPENDENCE DAY, occurred when one of the enormous alien spacecraft--bigger even than those diamond-shaped Imperial battleships from STAR WARS--positioned itself over the White House and, without hesitation, promptly vaporized the main quarters of the president of the United States. The scene resonated for a number of reasons, not the least of which was the fact that here was a symbol of, if not greatness, then at least consumate achievement in political affairs that was rendered mere ash by the flip of a switch from above. |
| I think of this scene of destruction when looking at the 20-month diamond top in the Dow Jones Industrial Average sent to us a few days ago by leddy@lasercraft.com.au. Just in case we didn't get the point, leddy included a daily chart of the past two years in the DJIA, a weekly chart taking in the past three years, a long-term arithmetic chart that shows the diamond top in the context of fifteen years of Dow activity and, just for good measure, a long-term, semi-logarithmic chart. Suffice it to say, we got it. |

|
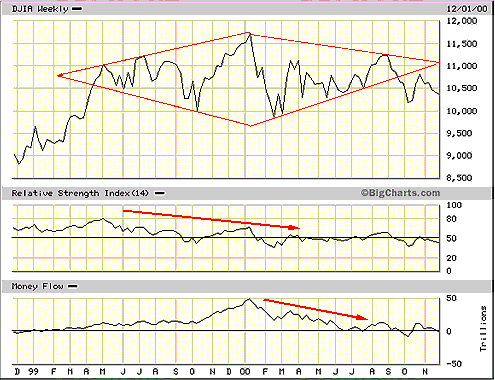
| The bearish diamond top hovering over the Dow Jones Industrial Average gets no argument from declining relative strength and a significant drop off in money flow since the Dow's January 2000 peak. |
| Graphic provided by: Bigcharts.com. |
| |
| Diamond tops are typically reversal formations and, insofar as they occur at market tops, tend to anticipate bearish times to come. Often diamond tops go through a number of other small formations en route to developing into a full-fledged diamond top. As the chart below points out, the current DJIA diamond top started out as a potentially bullish, broadening formation in April 1999. Incidentally, as a broadening top, the formation would have failed in April 2000, when prices did not rally to new highs (and a formation breakout) after the lows of March. |
| But occurring when and where it does, the current DJIA diamond top seems to strongly suggest weakness in the industrial average. There is no strongly downward volume trend over the 20-month period it has taken the diamond top to form (declining volumes are often the case during the development of diamond tops). Still, there are other indicators that do contribute to the bearish picture of the diamond top. The relative strength index shows a fairly steady decline from a peak in March 1999. Money flow reaches a peak early in January 2000, almost at the exact same time of the DJIA's peak. The declines in money flow from that peak continue to the present day. |
| How big could a bearish reversal in the Dow be? Probably nothing as vertigo-inducing as the Nasdaq's current swoon, but the size of the diamond top over the Dow is instructive. Edwards and Magee, authors of the classic, TECHNICAL ANALYSIS OF STOCK TRENDS, cite a minimum measuring rule that calls for prices to fall a minimum distance equal to the widest range between the top of the formation and the bottom. If the diamond top peak is 11,750 and the trough in the diamond top is about 10,000, then a downside of 1,750 points has to be considered realistic. And if the initial breakout occurred in late September (followed by the October downturn), then a DJIA as low as 9,000 (23% off the high) should surprise no one. |
Technical Writer for Technical Analysis of STOCKS & COMMODITIES magazine, Working-Money.com, and Traders.com Advantage.
| Title: | Technical Writer |
| Company: | Technical Analysis, Inc. |
| Address: | 4757 California Avenue SW |
| Seattle, WA 98116 | |
| Phone # for sales: | 206 938 0570 |
| Fax: | 206 938 1307 |
| Website: | www.Traders.com |
| E-mail address: | DPenn@traders.com |
Traders' Resource Links | |
| Charting the Stock Market: The Wyckoff Method -- Books | |
| Working-Money.com -- Online Trading Services | |
| Traders.com Advantage -- Online Trading Services | |
| Technical Analysis of Stocks & Commodities -- Publications and Newsletters | |
| Working Money, at Working-Money.com -- Publications and Newsletters | |
| Traders.com Advantage -- Publications and Newsletters | |
| Professional Traders Starter Kit -- Software | |
Click here for more information about our publications!
Comments

|

Request Information From Our Sponsors
- StockCharts.com, Inc.
- Candle Patterns
- Candlestick Charting Explained
- Intermarket Technical Analysis
- John Murphy on Chart Analysis
- John Murphy's Chart Pattern Recognition
- John Murphy's Market Message
- MurphyExplainsMarketAnalysis-Intermarket Analysis
- MurphyExplainsMarketAnalysis-Visual Analysis
- StockCharts.com
- Technical Analysis of the Financial Markets
- The Visual Investor
- VectorVest, Inc.
- Executive Premier Workshop
- One-Day Options Course
- OptionsPro
- Retirement Income Workshop
- Sure-Fire Trading Systems (VectorVest, Inc.)
- Trading as a Business Workshop
- VectorVest 7 EOD
- VectorVest 7 RealTime/IntraDay
- VectorVest AutoTester
- VectorVest Educational Services
- VectorVest OnLine
- VectorVest Options Analyzer
- VectorVest ProGraphics v6.0
- VectorVest ProTrader 7
- VectorVest RealTime Derby Tool
- VectorVest Simulator
- VectorVest Variator
- VectorVest Watchdog
