HOT TOPICS LIST
- MACD
- Fibonacci
- RSI
- Gann
- ADXR
- Stochastics
- Volume
- Triangles
- Futures
- Cycles
- Volatility
- ZIGZAG
- MESA
- Retracement
- Aroon
INDICATORS LIST
LIST OF TOPICS
PRINT THIS ARTICLE
by David Penn
Turtle trading as an analytic tool.
Position: N/A
David Penn
Technical Writer for Technical Analysis of STOCKS & COMMODITIES magazine, Working-Money.com, and Traders.com Advantage.
PRINT THIS ARTICLE
TRADING SYSTEMS
Long-Term Trend Trading
05/04/07 11:52:40 AMby David Penn
Turtle trading as an analytic tool.
Position: N/A
| In spite of all the evidence that suggests that long-term trend trading is the closest thing in the trading world to a holy grail, many if not most traders remain focused on the short term — myself included. So it was a true pleasure to spend an evening devouring Curtis Faith's new book, Way Of The Turtle, which describes his experience as a member of the original class of Richard Dennis's and William Eckhardt's turtle traders. By now the story of the turtle traders is likely known to all. The short version is that Dennis and Eckhardt launched a test in the early 1980s to see whether trading ability was something people were born with or something that could be taught. While not all of those who were admitted into the program were as successful as Faith and some of the other top-performing "turtles," the fact that much of the success of the best turtles could be credited to their strict adherence to Dennis' and Eckhardt's rules was seen as a validation of the turtle trading approach. |

|
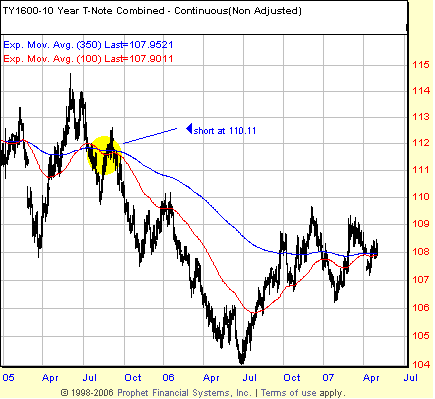
| FIGURE 1: US TREASURY NOTE, CONTINUOUS FUTURES, DAILY. The last signal in the dual moving average trend trading system occurred in August 2005. The T-note appears to have bottomed in the summer of 2006 and, having bounced, moves closer to initiating a trend buy signal, should the 100-day EMA (in red) cross over the 350-day EMA (in blue). |
| Graphic provided by: Prophet Financial, Inc. |
| |
| Faith's book hasn't converted me into a trend-trading reptile (though Way Of The Turtle should be recommended reading for traders regardless of where they are in the bestiary), and he is quick to point out that trading in general and trend trading in specific is more about making money than "being right." But that doesn't mean that those of us who tend to be shorter-term oriented in our trading can't use trend-following methods to gain a sense of overall market direction and the context in which our breakout, swing, or even daytrades in the future might be made. Consider, for example, just one of the turtle trading strategies Faith discusses in his book. This strategy, the dual moving average strategy, is an "always in" system — meaning the speculator is always either long or short the market. The two moving averages — and I used exponential moving averages (EMAs) — were the 100-day and the 350-day forms. The system couldn't have been any simpler. Go long when the 100-day crosses over the 350-day. Exit and go short when the 100-day crosses under the 350-day. This strategy performed very well from 1996 to 2006, reeling in a 57.8% compound annual growth rate, and an impressive MAR ratio (annual return divided by largest drawdown) of 1.82. |
| I then went looking for markets in which a 100-day EMA might be crossing a 350-day EMA. Given the performance of the dual moving average system, I suspected that if I could find such a cross in the making, there was a good chance that I might have stumbled across a potentially significant change in trend. The last such cross in the Standard & Poor's 500, for example, was in September 2003. In the QQQQ, the 100-day EMA crossed above the 350-day EMA as recently as October 2006 at 41.30 (as of this writing, the QQQQ are trading at 46.43). Long-term trend trading is often most effective in what Faith calls "fundamentals-driven markets," in which prices are moved less by speculators and more by what he calls "larger macro-economic forces." Both the currency and interest rate markets would qualify. Second place on Faith's list are the "speculator-driven markets," such as precious metals and energies. These markets are more difficult for trend traders, but still preferable to a third type, "aggregated derivative markets" like stock index futures, which Faith notes he personally avoided while turtle trading. |
| As such, I went looking in the commodities markets for possible near-term 100-day EMA crosses of the 350-day EMA. The first was a potential cross in the continuous futures contract for the 10-year Treasury note (Figure 1). The last cross in T-notes was a short signal back in August 2005, when the notes were trading near 110. Within weeks after the short entry, T-notes spiked higher but then fell back into a downtrend that saw them fall almost to 104 by summer 2006. Since then, T-notes have rallied to as high as 109.5 late in 2006, but the dual moving average system has yet to produce a buy signal. This may be about to change. A higher low in the second quarter of 2007 seems to be pulling the shorter, 100-day EMA higher. As of this writing, the 100-day EMA is only 0.05 below the 350-day EMA. Any sustained buying in T-notes whatsoever is likely to lead to a bullish cross, and a new, long-term buy signal in the 10-year Treasury. |

|
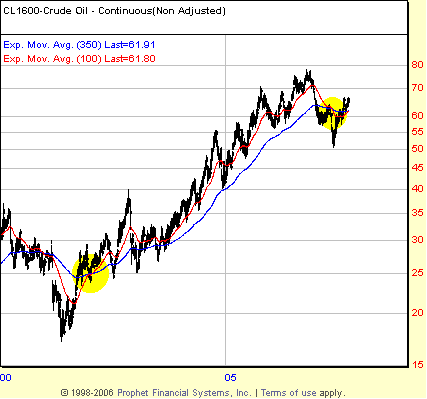
| FIGURE 2: CRUDE OIL, CONTINUOUS FUTURES, DAILY. With a dual moving average system trend buy in June 2002, traders saw crude oil climb from the mid-20s to the high 70s before the trend reversed. In spite of the typical trend trade "giveback" as the trend "bent" at the end, crude oil had doubled by the time the trade was exited in January 2007. |
| Graphic provided by: Prophet Financial, Inc. |
| |
| The second interesting instance was a recent bullish cross in the continuous futures contract for crude oil (Figure 2). The June crude had been a long-term buy since June 2002, when crude oil prices were in the mid-high 20s and the 100-day EMA crossed above the 350-day EMA. Basis continuous futures, crude oil ran as high as $78 in the summer of 2006 before topping out and reversing. A 100/350 dual moving average sell-and-go-short signal appeared in January 2007 with crude oil at approximately 56, but this signal has been a painful one as crude oil has rallied above 66 over the balance of 2007. This rally, however, has brought the 100- and 350-day exponential moving averages closer, to the point where as of this writing, those EMAs are about 11 cents apart. As is the case with T-notes in the previous example, any sustained buying over the next few days will result in a new buy signal — and potentially a new, long-term trend — in crude oil futures. |
Technical Writer for Technical Analysis of STOCKS & COMMODITIES magazine, Working-Money.com, and Traders.com Advantage.
| Title: | Technical Writer |
| Company: | Technical Analysis, Inc. |
| Address: | 4757 California Avenue SW |
| Seattle, WA 98116 | |
| Phone # for sales: | 206 938 0570 |
| Fax: | 206 938 1307 |
| Website: | www.Traders.com |
| E-mail address: | DPenn@traders.com |
Traders' Resource Links | |
| Charting the Stock Market: The Wyckoff Method -- Books | |
| Working-Money.com -- Online Trading Services | |
| Traders.com Advantage -- Online Trading Services | |
| Technical Analysis of Stocks & Commodities -- Publications and Newsletters | |
| Working Money, at Working-Money.com -- Publications and Newsletters | |
| Traders.com Advantage -- Publications and Newsletters | |
| Professional Traders Starter Kit -- Software | |
Click here for more information about our publications!
Comments
Date: 05/04/07Rank: 3Comment:

Request Information From Our Sponsors
- StockCharts.com, Inc.
- Candle Patterns
- Candlestick Charting Explained
- Intermarket Technical Analysis
- John Murphy on Chart Analysis
- John Murphy's Chart Pattern Recognition
- John Murphy's Market Message
- MurphyExplainsMarketAnalysis-Intermarket Analysis
- MurphyExplainsMarketAnalysis-Visual Analysis
- StockCharts.com
- Technical Analysis of the Financial Markets
- The Visual Investor
- VectorVest, Inc.
- Executive Premier Workshop
- One-Day Options Course
- OptionsPro
- Retirement Income Workshop
- Sure-Fire Trading Systems (VectorVest, Inc.)
- Trading as a Business Workshop
- VectorVest 7 EOD
- VectorVest 7 RealTime/IntraDay
- VectorVest AutoTester
- VectorVest Educational Services
- VectorVest OnLine
- VectorVest Options Analyzer
- VectorVest ProGraphics v6.0
- VectorVest ProTrader 7
- VectorVest RealTime Derby Tool
- VectorVest Simulator
- VectorVest Variator
- VectorVest Watchdog
