HOT TOPICS LIST
- MACD
- Fibonacci
- RSI
- Gann
- ADXR
- Stochastics
- Volume
- Triangles
- Futures
- Cycles
- Volatility
- ZIGZAG
- MESA
- Retracement
- Aroon
INDICATORS LIST
LIST OF TOPICS
PRINT THIS ARTICLE
by Arthur Hill
The US Dollar Index remains in a clear downtrend, but the index is firming near oversold territory and looks ripe for at least a bounce.
Position: Accumulate
Arthur Hill
Arthur Hill is currently editor of TDTrader.com, a website specializing in trading strategies, sector/industry specific breadth stats and overall technical analysis. He passed the Society of Technical Analysts (STA London) diploma exam with distinction is a Certified Financial Technician (CFTe). Prior to TD Trader, he was the Chief Technical Analyst for Stockcharts.com and the main contributor to the ChartSchool.
PRINT THIS ARTICLE
OVERBOUGHT OVERSOLD
US Dollar Index Firms At Support
05/01/07 01:48:26 PMby Arthur Hill
The US Dollar Index remains in a clear downtrend, but the index is firming near oversold territory and looks ripe for at least a bounce.
Position: Accumulate
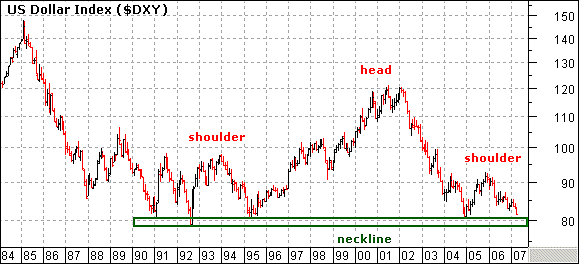
| On the weekly chart (Figure 1), the US dollar traced out a massive head & shoulders pattern from 1990 to 2007. The left shoulder peaked in 1993–94, the head peaked in 2001, and the right shoulder peaked in 2005. The index declined to neckline support over the last 18 months, and now, a big test awaits. A break below neckline support would seal the dollar's fate for a long time to come. |

|
| FIGURE 1: US DOLLAR INDEX, WEEKLY. Here, the dollar traced out a massive head & shoulders patter from 1990 to 2007. |
| Graphic provided by: MetaStock. |
| |
| Support is holding for now, and the head & shoulders remains a potentially bearish pattern. These patterns require confirmation, and the index needs to close below 80 to start the confirmation process. As long as support holds, there is a chance for a bounce off this level and traders should also prepare for some upside. |
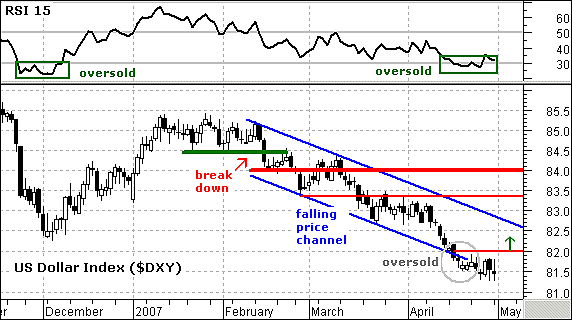
| On the daily chart (Figure 2), the US dollar remains in a clear downtrend, but became oversold at the end of April. Two items point to oversold conditions. The relative strength index (RSI) moved below 70 for the fifth time since 2004 and the index moved outside the falling price channel (gray oval). Both show that the decline has reached an extreme and we should prepare for an oversold bounce. |

|
| FIGURE 2: US DOLLAR INDEX, DAILY. The dollar remains in a clear downtrend, but it became oversold at the end of April. |
| Graphic provided by: MetaStock. |
| |
| In addition to oversold conditions, the index managed to firm over the last nine days. There were a couple of rally attempts but each fell short, and the 82 level marks the first line of resistance. A break above this level would be positive and start the oversold bounce. A correction rally could retrace 50–62% of the prior decline, and this would target a move to around 83.4–84. There is also resistance in this area from broken support. |
Arthur Hill is currently editor of TDTrader.com, a website specializing in trading strategies, sector/industry specific breadth stats and overall technical analysis. He passed the Society of Technical Analysts (STA London) diploma exam with distinction is a Certified Financial Technician (CFTe). Prior to TD Trader, he was the Chief Technical Analyst for Stockcharts.com and the main contributor to the ChartSchool.
| Title: | Editor |
| Company: | TDTrader.com |
| Address: | Willem Geetsstraat 17 |
| Mechelen, B2800 | |
| Phone # for sales: | 3215345465 |
| Website: | www.tdtrader.com |
| E-mail address: | arthurh@tdtrader.com |
Traders' Resource Links | |
| TDTrader.com has not added any product or service information to TRADERS' RESOURCE. | |
Click here for more information about our publications!
Comments
Date: 05/03/07Rank: 4Comment:

|

Request Information From Our Sponsors
- StockCharts.com, Inc.
- Candle Patterns
- Candlestick Charting Explained
- Intermarket Technical Analysis
- John Murphy on Chart Analysis
- John Murphy's Chart Pattern Recognition
- John Murphy's Market Message
- MurphyExplainsMarketAnalysis-Intermarket Analysis
- MurphyExplainsMarketAnalysis-Visual Analysis
- StockCharts.com
- Technical Analysis of the Financial Markets
- The Visual Investor
- VectorVest, Inc.
- Executive Premier Workshop
- One-Day Options Course
- OptionsPro
- Retirement Income Workshop
- Sure-Fire Trading Systems (VectorVest, Inc.)
- Trading as a Business Workshop
- VectorVest 7 EOD
- VectorVest 7 RealTime/IntraDay
- VectorVest AutoTester
- VectorVest Educational Services
- VectorVest OnLine
- VectorVest Options Analyzer
- VectorVest ProGraphics v6.0
- VectorVest ProTrader 7
- VectorVest RealTime Derby Tool
- VectorVest Simulator
- VectorVest Variator
- VectorVest Watchdog
