HOT TOPICS LIST
- MACD
- Fibonacci
- RSI
- Gann
- ADXR
- Stochastics
- Volume
- Triangles
- Futures
- Cycles
- Volatility
- ZIGZAG
- MESA
- Retracement
- Aroon
INDICATORS LIST
LIST OF TOPICS
PRINT THIS ARTICLE
by Gary Grosschadl
VeriSign Inc., which is the encryption and authentication leader on the Internet (which most people recognize as the small padlock icon in their web browser when shopping online), has edged past a breakout point.
Position: Buy
Gary Grosschadl
Independent Canadian equities trader and technical analyst based in Peterborough
Ontario, Canada.
PRINT THIS ARTICLE
ASCENDING TRIANGLES
VeriSign Hints At A Breakout
05/01/07 08:30:12 AMby Gary Grosschadl
VeriSign Inc., which is the encryption and authentication leader on the Internet (which most people recognize as the small padlock icon in their web browser when shopping online), has edged past a breakout point.
Position: Buy
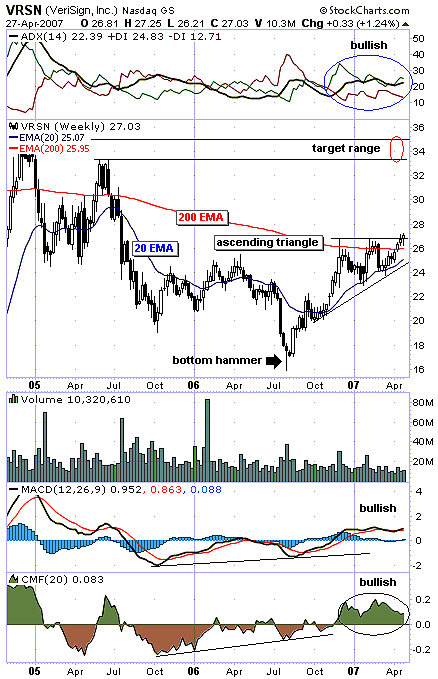
| Figure 1, this weekly chart, shows an ascending triangle breakout with a close just above the upper trendline. Breakouts ideally are marked with exceptional volume, but that has not occurred yet, so the move may be suspect. The next few trading sessions may shed some light regarding if it will be a breakout with any gusto. Note this also relates to a move above the 200-period moving average, giving added significance. |
| The measurement for an upside move for a formation like this comes from the widest part of the triangle, as applied to the upside break past the upper trendline. The widest part of the triangle yields seven points (27 - 20). This gives an upside target of 34 (27 + 7). This lies between two previous highs on this chart, roughly 33 - 35. |

|
| FIGURE 1: VRSN, WEEKLY. Verisign poised to go higher on this chart. |
| Graphic provided by: StockCharts.com. |
| |
| Several indicators are worthy of mention. The directional movement indicator (DMI) at the top of the chart shows a bullish stance with the average directional index (ADX) above 20 and the positive directional indicator (+DI) atop the bearish counterpart of -DI. Ideally, what we need to see here is the ADX to continue higher via an upslope. |
| The first thing to note on the lower indicators is the bullish positive divergence that was apparent at the bottom hammer candlestick. Both the moving average convergence/divergence (MACD) and the Chaikin money flow (CMF) indicators moved higher as the stock price hit a new low. This often foretells a coming upleg or reversal. Both indicators remain in bullish territory and have upside room. |
| In summary, a breakout is possibly under way, but more volume is needed to sustain any upward thrust or the move could wilt and retest the triangle's lower trendline or the nearby 20-day EMA. Note how the two moving averages also trace out an ascending triangle pattern. |
Independent Canadian equities trader and technical analyst based in Peterborough
Ontario, Canada.
| Website: | www.whatsonsale.ca/financial.html |
| E-mail address: | gwg7@sympatico.ca |
Click here for more information about our publications!
Comments
Date: 05/01/07Rank: 5Comment:

Request Information From Our Sponsors
- StockCharts.com, Inc.
- Candle Patterns
- Candlestick Charting Explained
- Intermarket Technical Analysis
- John Murphy on Chart Analysis
- John Murphy's Chart Pattern Recognition
- John Murphy's Market Message
- MurphyExplainsMarketAnalysis-Intermarket Analysis
- MurphyExplainsMarketAnalysis-Visual Analysis
- StockCharts.com
- Technical Analysis of the Financial Markets
- The Visual Investor
- VectorVest, Inc.
- Executive Premier Workshop
- One-Day Options Course
- OptionsPro
- Retirement Income Workshop
- Sure-Fire Trading Systems (VectorVest, Inc.)
- Trading as a Business Workshop
- VectorVest 7 EOD
- VectorVest 7 RealTime/IntraDay
- VectorVest AutoTester
- VectorVest Educational Services
- VectorVest OnLine
- VectorVest Options Analyzer
- VectorVest ProGraphics v6.0
- VectorVest ProTrader 7
- VectorVest RealTime Derby Tool
- VectorVest Simulator
- VectorVest Variator
- VectorVest Watchdog
