HOT TOPICS LIST
- MACD
- Fibonacci
- RSI
- Gann
- ADXR
- Stochastics
- Volume
- Triangles
- Futures
- Cycles
- Volatility
- ZIGZAG
- MESA
- Retracement
- Aroon
INDICATORS LIST
LIST OF TOPICS
PRINT THIS ARTICLE
by Chaitali Mohile
STRA has moved out of a flag & pennant formation. The rally will lead to a new level of $131.
Position: Buy
Chaitali Mohile
Active trader in the Indian stock markets since 2003 and a full-time writer. Trading is largely based upon technical analysis.
PRINT THIS ARTICLE
FLAGS AND PENNANTS
Strayer Education Breaks Out
05/02/07 11:53:13 AMby Chaitali Mohile
STRA has moved out of a flag & pennant formation. The rally will lead to a new level of $131.
Position: Buy
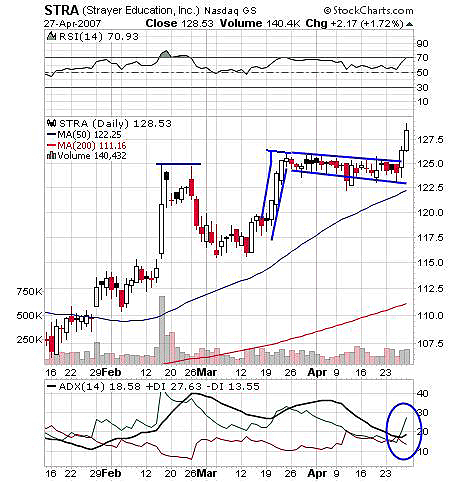
| The flag & pennant formation is a bullish formation in an uptrend. It is the continuation of the previous rally. STRA has a flag & pennant formation near its previous high $125. Stocks often fail to cross this resistance and then correct. But consolidation at this level indicates that STRA is a strong stock with a bullish strength in the rally. The advance rally from $119 to $125 is the flagpole and the long consolidation is the flag. See Figure 1. |
| The average directional movement index (ADX)(14) at 18 indicates a developing uptrend. The positive directional index (+DI) moved steeply over the ADX, showing increasing pressure of buyers. The breakout on heavy volume always leads to a successful rally in same direction, so +DI at 27.55 is encouraging. The relative strength index (RSI)(14) has rallied above 50 for a much longer time, confirming the stability in a bullish move. With a breakout, the RSI is trying to move above 70. Thus, the RSI shows healthy buying levels for traders during the breakout. |

|
| FIGURE 1: STRAYER, DAILY.This flag & pennant breakout will see a target of $131. |
| Graphic provided by: StockCharts.com. |
| |
| Traders can thus go long with the target of $131. This level is calculated considering the length of a flagpole at $6 ($125 - $119). Adding $6 to the breakout level at the $125 target is seen. |

|
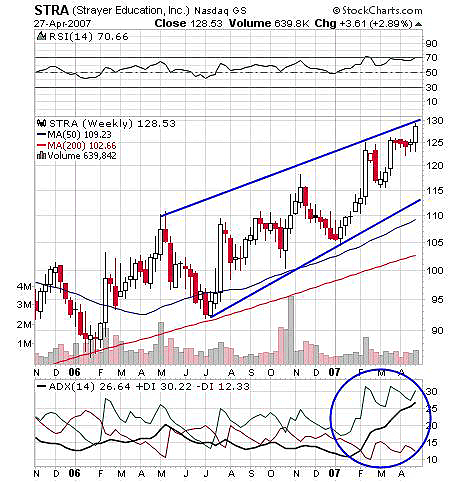
| FIGURE 2: STRAYER, WEEKLY. STRA has been in a broader channel in the direction of the 50-day moving average. |
| Graphic provided by: StockCharts.com. |
| |
| STRA is moving in a broader channel in its weekly chart (Figure 2). The lower trendline of the channel offered strong support against the correction from mid-November 2006. The bullish rally from this support at $105 gave a good buying opportunity. With this upside move, the RSI (14) has also turned marginally overbought, and still has room to continue the upside move. The ADX (14) at 26 indicates a developing uptrend. |
Active trader in the Indian stock markets since 2003 and a full-time writer. Trading is largely based upon technical analysis.
| Company: | Independent |
| Address: | C1/3 Parth Indraprasth Towers. Vastrapur |
| Ahmedabad, Guj 380015 | |
| E-mail address: | chaitalimohile@yahoo.co.in |
Traders' Resource Links | |
| Independent has not added any product or service information to TRADERS' RESOURCE. | |
Click here for more information about our publications!
Comments
Date: 05/03/07Rank: 4Comment:

Request Information From Our Sponsors
- StockCharts.com, Inc.
- Candle Patterns
- Candlestick Charting Explained
- Intermarket Technical Analysis
- John Murphy on Chart Analysis
- John Murphy's Chart Pattern Recognition
- John Murphy's Market Message
- MurphyExplainsMarketAnalysis-Intermarket Analysis
- MurphyExplainsMarketAnalysis-Visual Analysis
- StockCharts.com
- Technical Analysis of the Financial Markets
- The Visual Investor
- VectorVest, Inc.
- Executive Premier Workshop
- One-Day Options Course
- OptionsPro
- Retirement Income Workshop
- Sure-Fire Trading Systems (VectorVest, Inc.)
- Trading as a Business Workshop
- VectorVest 7 EOD
- VectorVest 7 RealTime/IntraDay
- VectorVest AutoTester
- VectorVest Educational Services
- VectorVest OnLine
- VectorVest Options Analyzer
- VectorVest ProGraphics v6.0
- VectorVest ProTrader 7
- VectorVest RealTime Derby Tool
- VectorVest Simulator
- VectorVest Variator
- VectorVest Watchdog
