

HOT TOPICS LIST
- MACD
- Fibonacci
- RSI
- Gann
- ADXR
- Stochastics
- Volume
- Triangles
- Futures
- Cycles
- Volatility
- ZIGZAG
- MESA
- Retracement
- Aroon
INDICATORS LIST
LIST OF TOPICS
PRINT THIS ARTICLE
by Chaitali Mohile
The DJUA has formed a bearish wedge, so keep an eye out on this index.
Position: N/A
Chaitali Mohile
Active trader in the Indian stock markets since 2003 and a full-time writer. Trading is largely based upon technical analysis.
PRINT THIS ARTICLE
WEDGE FORMATIONS
Dow Jones Utility Average Moves Down From Bearish Wedge
05/01/07 09:07:54 AMby Chaitali Mohile
The DJUA has formed a bearish wedge, so keep an eye out on this index.
Position: N/A
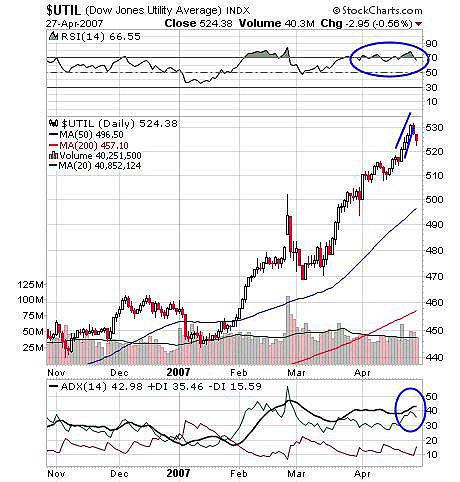
| A rising wedge in an uptrend is a bearish indication. The vertical rally from $510 to $530 formed a bearish wedge in the Dow Jones Utility Average ($UTIL). The breakout direction in this formation is mostly downward. I wrote "mostly," as patterns have tendencies to fail too; $UTIL has moved down and volume can reduced further as the drop proceeds. The price can retrace to $520 as its previous low pivot. The exact fall cannot be judged till it actually happens. The rising wedge in $UTIL can change its previous uptrend and a new downtrend is likely to begin. Considering this reversal pattern, the $510 level may serve as its final support. See Figure 1. |
|
| FIGURE 1: $UTIL, DAILY. This index is about to start its new downtrend; the 520 level is the first support during this drop. |
| Graphic provided by: StockCharts.com. |
| |
| The relative strength index (RSI)(14) has carried a bullish rally on an overbought position. Though this indicator can remain overbought for a longer period, it has begun its downward journey. The previous high for the RSI was marginally above 80, but the current rally failed to cross the landmark. This indicates the beginning of the bearish rally. The average directional index (ADX)(14) is a trend-following indicator. The indicator is considered overheated above 40, resulting in a decline in the trend. Figure 1, above the ADX, is marginally overheated at 42, which thus indicates a decline in the trend. The positive directional index (+DI) has also tipped down, reducing buyers' pressure in the stock. |
| Traders should consider booking profits on this index. In addition, they need not jump on short positions immediately on breakout. If $520 gets violated, then positions should be shorted. |
|
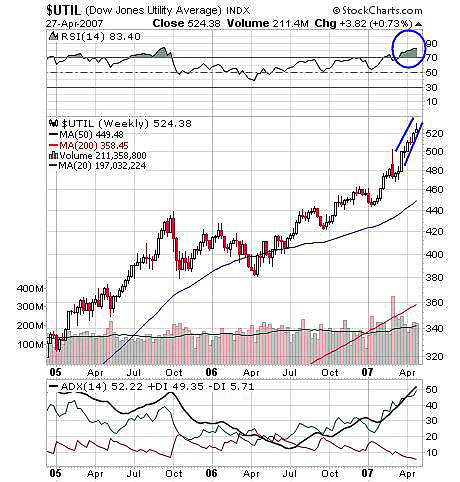
| FIGURE 2: $UTIL, WEEKLY. The rising wedge on this chart reinforces the pattern as the possibility of trend changes increases. |
| Graphic provided by: StockCharts.com. |
| |
| Figure 2 (the weekly chart) shows a strong uptrend from $440 in October 2006; $440 offered support for the bullish rally from the previous high. $UTIL has rallied from $440 to $520, with necessary consolidation at different levels. In Figure 2, the index has formed a rising wedge again. The ADX (14) is highly overheated at the 52 level, with an equally strong +DI. Such condition points to the decline and change in the trend. The RSI (14) has never crossed 70 but has remained bullish throughout the rally to $500. The RSI is highly overbought above 80 and can continue there longer. But traders should consider this overbought level as the ADX (14) is also highly overheated. |
| This strong uptrend is likely to change due to a bearish wedge being formed. Traders can take profit on $UTIL. Though a new downtrend can begin, a short position is not advisable at current levels. |
Active trader in the Indian stock markets since 2003 and a full-time writer. Trading is largely based upon technical analysis.
| Company: | Independent |
| Address: | C1/3 Parth Indraprasth Towers. Vastrapur |
| Ahmedabad, Guj 380015 | |
| E-mail address: | chaitalimohile@yahoo.co.in |
Traders' Resource Links | |
| Independent has not added any product or service information to TRADERS' RESOURCE. | |
Click here for more information about our publications!
Comments
Date:�05/01/07Rank:�4Comment:�
Date:�05/01/07Rank:�1Comment:�

Request Information From Our Sponsors
- VectorVest, Inc.
- Executive Premier Workshop
- One-Day Options Course
- OptionsPro
- Retirement Income Workshop
- Sure-Fire Trading Systems (VectorVest, Inc.)
- Trading as a Business Workshop
- VectorVest 7 EOD
- VectorVest 7 RealTime/IntraDay
- VectorVest AutoTester
- VectorVest Educational Services
- VectorVest OnLine
- VectorVest Options Analyzer
- VectorVest ProGraphics v6.0
- VectorVest ProTrader 7
- VectorVest RealTime Derby Tool
- VectorVest Simulator
- VectorVest Variator
- VectorVest Watchdog
- StockCharts.com, Inc.
- Candle Patterns
- Candlestick Charting Explained
- Intermarket Technical Analysis
- John Murphy on Chart Analysis
- John Murphy's Chart Pattern Recognition
- John Murphy's Market Message
- MurphyExplainsMarketAnalysis-Intermarket Analysis
- MurphyExplainsMarketAnalysis-Visual Analysis
- StockCharts.com
- Technical Analysis of the Financial Markets
- The Visual Investor