HOT TOPICS LIST
- MACD
- Fibonacci
- RSI
- Gann
- ADXR
- Stochastics
- Volume
- Triangles
- Futures
- Cycles
- Volatility
- ZIGZAG
- MESA
- Retracement
- Aroon
INDICATORS LIST
LIST OF TOPICS
PRINT THIS ARTICLE
by Gary Grosschadl
When a previously faltering stock manages to once again find support above its 200-day moving average, it's a bullish sign.
Position: Hold
Gary Grosschadl
Independent Canadian equities trader and technical analyst based in Peterborough
Ontario, Canada.
PRINT THIS ARTICLE
MOVING AVERAGES
Dell Inc. Finds Major Support
04/30/07 09:45:31 AMby Gary Grosschadl
When a previously faltering stock manages to once again find support above its 200-day moving average, it's a bullish sign.
Position: Hold
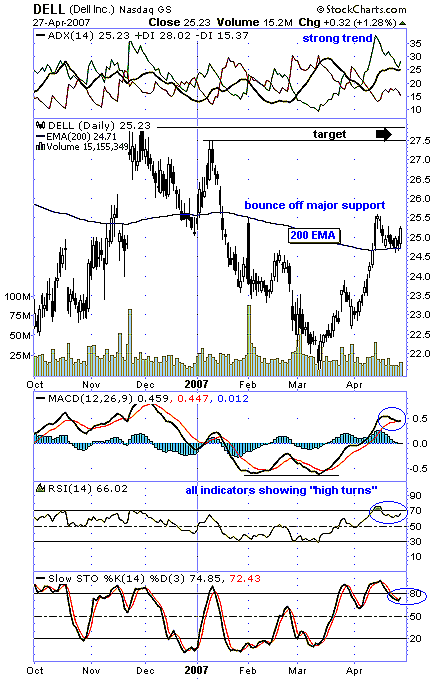
| Since December 2006, this stock had a 20% decline to bottom near $22. Recently, it popped above its 20-day exponential moving average (EMA), and now this level has been successfully tested. This paves the way for further upside. |
| Several indicators are examined. At the top of Figure 1, the elements of the directional movement indicator (DMI) are considered. A strong bullish trend is evidenced when the average directional movement indicator (ADX) rises above 20–25. With the ADX currently at 25.23 and the directional indicators (+DI and -DI) positioned on either side, further bullishness should develop. |

|
| FIGURE 1: DELL, DAILY. The Dell stock is bouncing off support. |
| Graphic provided by: StockCharts.com. |
| |
| Below Figure 1, several indicators are showing similar traits in that they all show a high bullish turn. The moving average convergence/divergence (MACD) shows an apparent bounce off its signal line while the relative strength indicator (RSI) and the stochastic oscillator are showing high bullish turns as well. This bodes well for likely continued upside. |
| The most obvious upside target is the target zone between $27.50 to $28. Look for either a reversal or another consolidation period when this area of previous resistance is met. This is bound to be a trading target for those short-term traders already onboard. This does not preclude further gains, but this would have to be fueled with high trading volume to convince new bulls to join. A surprise close below the current 200-day EMA negates these bullish considerations and the stock would likely fall lower to test previous support near $22.50 or just below $22. |
Independent Canadian equities trader and technical analyst based in Peterborough
Ontario, Canada.
| Website: | www.whatsonsale.ca/financial.html |
| E-mail address: | gwg7@sympatico.ca |
Click here for more information about our publications!
Comments
Date: 04/30/07Rank: 5Comment:

Request Information From Our Sponsors
- StockCharts.com, Inc.
- Candle Patterns
- Candlestick Charting Explained
- Intermarket Technical Analysis
- John Murphy on Chart Analysis
- John Murphy's Chart Pattern Recognition
- John Murphy's Market Message
- MurphyExplainsMarketAnalysis-Intermarket Analysis
- MurphyExplainsMarketAnalysis-Visual Analysis
- StockCharts.com
- Technical Analysis of the Financial Markets
- The Visual Investor
- VectorVest, Inc.
- Executive Premier Workshop
- One-Day Options Course
- OptionsPro
- Retirement Income Workshop
- Sure-Fire Trading Systems (VectorVest, Inc.)
- Trading as a Business Workshop
- VectorVest 7 EOD
- VectorVest 7 RealTime/IntraDay
- VectorVest AutoTester
- VectorVest Educational Services
- VectorVest OnLine
- VectorVest Options Analyzer
- VectorVest ProGraphics v6.0
- VectorVest ProTrader 7
- VectorVest RealTime Derby Tool
- VectorVest Simulator
- VectorVest Variator
- VectorVest Watchdog
