HOT TOPICS LIST
- MACD
- Fibonacci
- RSI
- Gann
- ADXR
- Stochastics
- Volume
- Triangles
- Futures
- Cycles
- Volatility
- ZIGZAG
- MESA
- Retracement
- Aroon
INDICATORS LIST
LIST OF TOPICS
PRINT THIS ARTICLE
by Koos van der Merwe
Is Rockyview Energy signaling a rise ahead of the summer holidays?
Position: Accumulate
Koos van der Merwe
Has been a technical analyst since 1969, and has worked as a futures and options trader with First Financial Futures in Johannesburg, South Africa.
PRINT THIS ARTICLE
CUP WITH HANDLE
Rockyview Energy — A Possible Buy?
04/26/07 01:46:31 PMby Koos van der Merwe
Is Rockyview Energy signaling a rise ahead of the summer holidays?
Position: Accumulate
| Rockyview was created in June 2005 through an arrangement with APF Energy Trust, prior to APF's merger with StarPoint Energy Trust. Rockyview commenced operation with an outstanding asset base; 1,000 boe/d of high netback production concentrated in greater Wood River area of central Alberta, Canada. At this time, there are 186 (93 net) drilling locations prospective for both conventional production and CBM. The company plans to grow through development and exploration drilling supplemented by acquisitions. This all sounds and looks good, and StarPoint Energy Trust is blue chip, but since the merger, Rockyview has fallen from a high of $6.45 to a low of $2.70. Is this because of a fall in oil prices over the period, or is this because the market no longer likes the company as structured, and that its exploration is not as successful as originally anticipated? Whatever the reason — as technicians, it is not ours to reason why — the chart is starting to look interesting now for the first time since May 2006. |

|
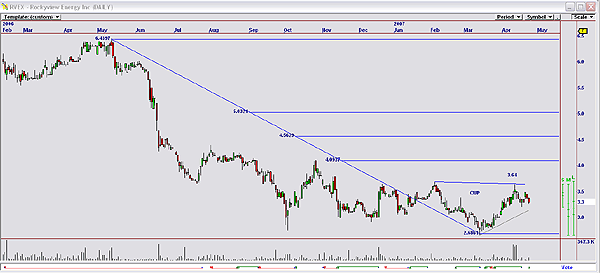
| FIGURE 1: ROCKYVIEW ENERGY. RVE-T is showing a cup with handle formation. |
| Graphic provided by: Omnitrader Professional. |
| |
| Figure 1 shows the fall from $6.45 in May 2006 to the low of $2.66 by March 14, 2007. The chart also shows Fibonacci retracement levels over this period as well as the cup that has developed, and its breakpoint of the handle at $3.64. All of these indicators suggest a buy signal. |
| The possible targets as suggested are as follows: a. Cup and handle = $4.60 (3.64-2.68=0.96+3.64=4.60) b. Fibonacci 38.2% retracement level = $4.09 c. 50% retracement level = $4.56 d. 61.8% retracement level = $5.03 In addition, note that the vote line on the Omnitrader chart has given a buy signal, one that those traders are prepared to take more risk can use. Figure 2 shows how this signal was calculated. |
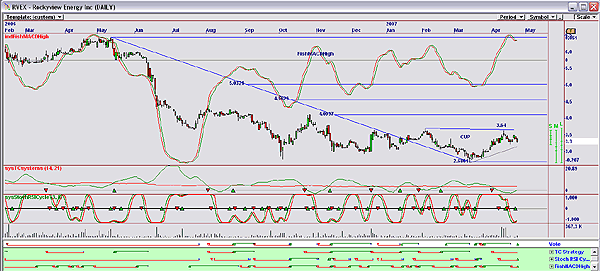
| Figure 2 shows the following: 1. The Fish MACD high indicator on the chart 2. The TC system indicator 3. The StochasticRSI cycle indicator. |

|
| FIGURE 2: ROCKYVIEW ENERGY. This stock is showing strategies used to determine the voting signal. |
| Graphic provided by: Omnitrader Professional. |
| |
| At the bottom of Figure 2, underneath the vote line, the signals given by each of these strategies is shown with the vote line, a culmination of these strategies into a viable trading strategy. The vote line, as mentioned, has given a buy signal. (Users of Omnitrader Professional are welcome to email me should they wish to receive the formulas for the strategies.) To conclude, an Omnitrader chart of Rockyview Energy is suggesting a buy at present levels. This is in conjunction with a possible future buy signal that a breakout of a cup and handle pattern could give some time in the future. |
Has been a technical analyst since 1969, and has worked as a futures and options trader with First Financial Futures in Johannesburg, South Africa.
| Address: | 3256 West 24th Ave |
| Vancouver, BC | |
| Phone # for sales: | 6042634214 |
| E-mail address: | petroosp@gmail.com |
Click here for more information about our publications!
Comments
Date: 04/30/07Rank: 2Comment:

Request Information From Our Sponsors
- StockCharts.com, Inc.
- Candle Patterns
- Candlestick Charting Explained
- Intermarket Technical Analysis
- John Murphy on Chart Analysis
- John Murphy's Chart Pattern Recognition
- John Murphy's Market Message
- MurphyExplainsMarketAnalysis-Intermarket Analysis
- MurphyExplainsMarketAnalysis-Visual Analysis
- StockCharts.com
- Technical Analysis of the Financial Markets
- The Visual Investor
- VectorVest, Inc.
- Executive Premier Workshop
- One-Day Options Course
- OptionsPro
- Retirement Income Workshop
- Sure-Fire Trading Systems (VectorVest, Inc.)
- Trading as a Business Workshop
- VectorVest 7 EOD
- VectorVest 7 RealTime/IntraDay
- VectorVest AutoTester
- VectorVest Educational Services
- VectorVest OnLine
- VectorVest Options Analyzer
- VectorVest ProGraphics v6.0
- VectorVest ProTrader 7
- VectorVest RealTime Derby Tool
- VectorVest Simulator
- VectorVest Variator
- VectorVest Watchdog
