HOT TOPICS LIST
- MACD
- Fibonacci
- RSI
- Gann
- ADXR
- Stochastics
- Volume
- Triangles
- Futures
- Cycles
- Volatility
- ZIGZAG
- MESA
- Retracement
- Aroon
INDICATORS LIST
LIST OF TOPICS
PRINT THIS ARTICLE
by David Penn
This pattern suggests even more upside for the NASDAQ 100.
Position: N/A
David Penn
Technical Writer for Technical Analysis of STOCKS & COMMODITIES magazine, Working-Money.com, and Traders.com Advantage.
PRINT THIS ARTICLE
BROADENING FORMATION
The QQQQ's Broadening Top
04/26/07 02:28:46 PMby David Penn
This pattern suggests even more upside for the NASDAQ 100.
Position: N/A
| Writing about broadening tops in the second edition of his book Encyclopedia Of Chart Patterns, Thomas Bulkowski notes clinically: "Price trend is upward leading to the formation. Megaphone appearance with higher highs and lower lows that widen over time. Breakout is upward." |

|
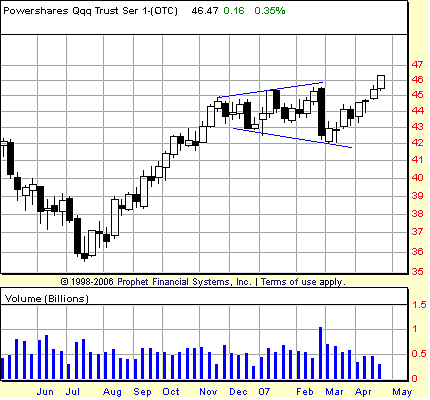
| FIGURE 1: POWERSHARES QQQ TRUST, WEEKLY. The broadening formation in the QQQQ developed over the course of more than three months from late November to early March, when the pattern was complete. |
| Graphic provided by: Prophet Financial, Inc. |
| |
| This is a perfect description of the broadening top that has defined the movement in the QQQQ since late November 2006 (Figure 1). Compared to their opposite, the symmetrical triangle, broadening tops are a bit more rare, and often confuse chartists at first with their pattern of higher highs and lower lows. However, like the symmetrical triangle, the broadening top is also a "continuation" pattern. This means that whatever trend was in effect when the consolidation pattern developed will continue once the consolidation has run its course. |

|
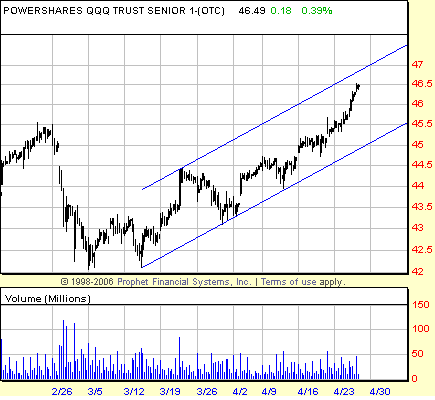
| FIGURE 2: POWERSHARES QQQ TRUST, TWO-HOUR. The rally from the low point of the broadening formation in the QQQQ moves toward the top of a trend channel, where some resistance should be expected. |
| Graphic provided by: Prophet Financial, Inc. |
| |
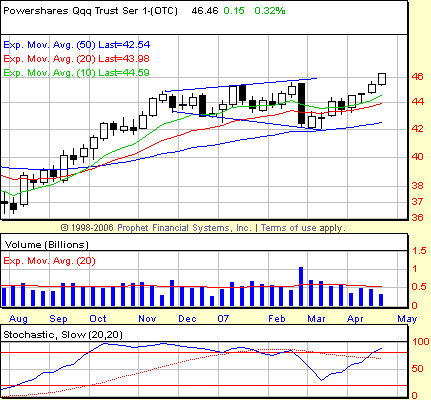
| How do you trade broadening tops? Bulkowski recommends that "once a broadening top appears, buy after the stock makes its turn at the low ... place a stop-loss order 0.15 below the minor low." The trick with this recommendation is figuring out when the stock has actually made "its turn at the low." In the case of the QQQQ -- especially in the weekly chart -- one big clue that the decline in late February marked "the low" was the fact that the market seemed to find support on the 50-week exponential moving average (EMA) (Figures 2 and 3). On the daily chart, there was support at the 42 level, which corresponded with the lows of the October-November consolidation that contributed to the QQQQ's inability to move lower as the broadening formation was completed. |

|
| FIGURE 3: POWERSHARES QQQ TRUST, WEEKLY. The correction in the QQQQ — and the low point of the broadening top formation — find support at the lowermost of the three moving averages shown: the 50-week exponential. |
| Graphic provided by: Prophet Financial, Inc. |
| |
| What sort of upside can traders and speculators in the QQQQ look forward to? The measurement rule for broadening tops with upside breakouts is straightforward: measure the formation at its widest point and add that amount to the value at the top of the formation. In this case, that would mean adding approximately four points to the value at the top of the pattern, which is approximately 46. This provides for a minimum upside target of 50 for the QQQQ. |
| The broadening top pattern can also be seen as a sort of measured move up in which the distance from the summer 2006 lows near 35.5 to the high of the broadening formation can be added to the low of the broadening formation to provide an upside target. Approaching the pattern in this way -- the formation low is approximately 42 versus a formation high of approximately 46 -- suggests an upside of 52.5, and that the 50 target might indeed be a "minimum" upside destination. |
Technical Writer for Technical Analysis of STOCKS & COMMODITIES magazine, Working-Money.com, and Traders.com Advantage.
| Title: | Technical Writer |
| Company: | Technical Analysis, Inc. |
| Address: | 4757 California Avenue SW |
| Seattle, WA 98116 | |
| Phone # for sales: | 206 938 0570 |
| Fax: | 206 938 1307 |
| Website: | www.Traders.com |
| E-mail address: | DPenn@traders.com |
Traders' Resource Links | |
| Charting the Stock Market: The Wyckoff Method -- Books | |
| Working-Money.com -- Online Trading Services | |
| Traders.com Advantage -- Online Trading Services | |
| Technical Analysis of Stocks & Commodities -- Publications and Newsletters | |
| Working Money, at Working-Money.com -- Publications and Newsletters | |
| Traders.com Advantage -- Publications and Newsletters | |
| Professional Traders Starter Kit -- Software | |
Click here for more information about our publications!
Comments
Date: 04/26/07Rank: 3Comment:
Date: 04/28/07Rank: 5Comment:

Request Information From Our Sponsors
- StockCharts.com, Inc.
- Candle Patterns
- Candlestick Charting Explained
- Intermarket Technical Analysis
- John Murphy on Chart Analysis
- John Murphy's Chart Pattern Recognition
- John Murphy's Market Message
- MurphyExplainsMarketAnalysis-Intermarket Analysis
- MurphyExplainsMarketAnalysis-Visual Analysis
- StockCharts.com
- Technical Analysis of the Financial Markets
- The Visual Investor
- VectorVest, Inc.
- Executive Premier Workshop
- One-Day Options Course
- OptionsPro
- Retirement Income Workshop
- Sure-Fire Trading Systems (VectorVest, Inc.)
- Trading as a Business Workshop
- VectorVest 7 EOD
- VectorVest 7 RealTime/IntraDay
- VectorVest AutoTester
- VectorVest Educational Services
- VectorVest OnLine
- VectorVest Options Analyzer
- VectorVest ProGraphics v6.0
- VectorVest ProTrader 7
- VectorVest RealTime Derby Tool
- VectorVest Simulator
- VectorVest Variator
- VectorVest Watchdog
