HOT TOPICS LIST
- MACD
- Fibonacci
- RSI
- Gann
- ADXR
- Stochastics
- Volume
- Triangles
- Futures
- Cycles
- Volatility
- ZIGZAG
- MESA
- Retracement
- Aroon
INDICATORS LIST
LIST OF TOPICS
PRINT THIS ARTICLE
by David Penn
Are the Dow transports failing to confirm the new highs in the Dow industrials?
Position: N/A
David Penn
Technical Writer for Technical Analysis of STOCKS & COMMODITIES magazine, Working-Money.com, and Traders.com Advantage.
PRINT THIS ARTICLE
REVERSAL
Transports Hesitate At The Top
04/25/07 01:52:11 PMby David Penn
Are the Dow transports failing to confirm the new highs in the Dow industrials?
Position: N/A
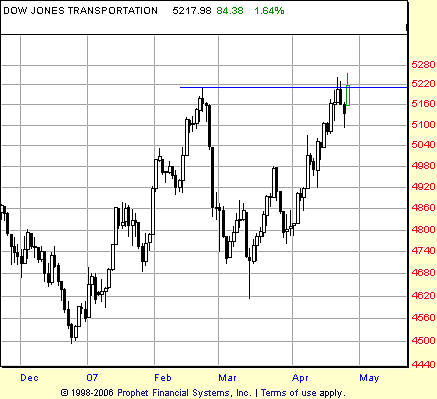
| With all the attention being paid to the Dow industrials' assault on the 13,000 level, less attention has been paid on the Dow transports, which also recently made a new, all-time high in mid-April. For while the industrials marched strongly beyond the February highs — the biggest technical barrier to the 13,000 level — the transports' move beyond its February 2007 highs so far has been less than impressive (Figure 1). |

|
| FIGURE 1: DOW JONES TRANSPORTATION AVERAGE, DAILY. The month of April finds the Dow transports struggling to sustain the breakout above the February highs. An effort to short the transports (using the exchange-traded fund IYT as a proxy) based on the 2B criteria would have been filled, only to have been stopped out in the next session as a new intraday high was reached. |
| Graphic provided by: Prophet Financial, Inc. |
| |
| It is hard to imagine a market looking more like a top than the Dow transports in April. While the March–April advance does not seem to have resulted in the sort of negative divergence in the moving average convergence/divergence (MACD) histogram that is often a clear sign that a top of some significance has developed, the transports' hesitation to show follow-through to the upside after breaking the February highs should make speculators concerned about the near-term staying power of the $TRAN. |

|
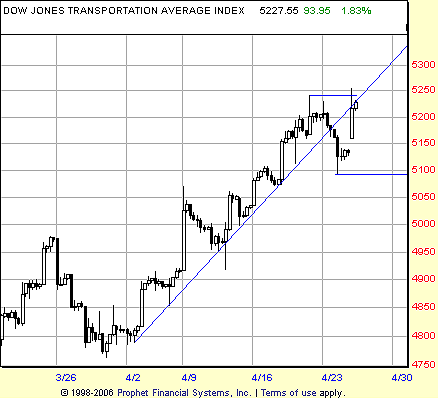
| FIGURE 2: DOW JONES TRANSPORTATION AVERAGE, TWO-HOUR. A 2B top is created as the transports break down below and then temporarily rally above their April trendline. Based on the trendline break and subsequent bounce (a 1-2-3 reversal setup), traders can focus on the 5250 level as key resistance and the 5100 level as critical support. |
| Graphic provided by: Prophet Financial, Inc. |
| |
| Given the trading in late April, where long shadows on candlesticks to the upside are matched by long shadows on candlesticks to the downside, there is a strong possibility that the transports will move sideways, consolidating their swiftly gotten gains, rather than break down in a collapse every bit as vertical as the advance was. Watching to see whether the transports break free from the 5250–5100 range (see Figure 2) will likely let traders know if a consolidation — perhaps the "handle" to the particularly deep March "cup" — is in the cards. |
Technical Writer for Technical Analysis of STOCKS & COMMODITIES magazine, Working-Money.com, and Traders.com Advantage.
| Title: | Technical Writer |
| Company: | Technical Analysis, Inc. |
| Address: | 4757 California Avenue SW |
| Seattle, WA 98116 | |
| Phone # for sales: | 206 938 0570 |
| Fax: | 206 938 1307 |
| Website: | www.Traders.com |
| E-mail address: | DPenn@traders.com |
Traders' Resource Links | |
| Charting the Stock Market: The Wyckoff Method -- Books | |
| Working-Money.com -- Online Trading Services | |
| Traders.com Advantage -- Online Trading Services | |
| Technical Analysis of Stocks & Commodities -- Publications and Newsletters | |
| Working Money, at Working-Money.com -- Publications and Newsletters | |
| Traders.com Advantage -- Publications and Newsletters | |
| Professional Traders Starter Kit -- Software | |
Click here for more information about our publications!
Comments
Date: 04/26/07Rank: 3Comment:

Request Information From Our Sponsors
- StockCharts.com, Inc.
- Candle Patterns
- Candlestick Charting Explained
- Intermarket Technical Analysis
- John Murphy on Chart Analysis
- John Murphy's Chart Pattern Recognition
- John Murphy's Market Message
- MurphyExplainsMarketAnalysis-Intermarket Analysis
- MurphyExplainsMarketAnalysis-Visual Analysis
- StockCharts.com
- Technical Analysis of the Financial Markets
- The Visual Investor
- VectorVest, Inc.
- Executive Premier Workshop
- One-Day Options Course
- OptionsPro
- Retirement Income Workshop
- Sure-Fire Trading Systems (VectorVest, Inc.)
- Trading as a Business Workshop
- VectorVest 7 EOD
- VectorVest 7 RealTime/IntraDay
- VectorVest AutoTester
- VectorVest Educational Services
- VectorVest OnLine
- VectorVest Options Analyzer
- VectorVest ProGraphics v6.0
- VectorVest ProTrader 7
- VectorVest RealTime Derby Tool
- VectorVest Simulator
- VectorVest Variator
- VectorVest Watchdog
