HOT TOPICS LIST
- MACD
- Fibonacci
- RSI
- Gann
- ADXR
- Stochastics
- Volume
- Triangles
- Futures
- Cycles
- Volatility
- ZIGZAG
- MESA
- Retracement
- Aroon
INDICATORS LIST
LIST OF TOPICS
PRINT THIS ARTICLE
by David Penn
Are the gold stocks saying something important about the potential for new highs in gold?
Position: N/A
David Penn
Technical Writer for Technical Analysis of STOCKS & COMMODITIES magazine, Working-Money.com, and Traders.com Advantage.
PRINT THIS ARTICLE
SUPPORT & RESISTANCE
Gold Meets Resistance
04/25/07 09:09:56 AMby David Penn
Are the gold stocks saying something important about the potential for new highs in gold?
Position: N/A
| I've been somewhat skeptical of gold's ability to move higher without significant pullback. Back in late February, I wrote that whether or not you believed that gold bottomed in October 2006, or had still more room to the downside, both instances involved gold moving lower before moving higher ("Waving The Gold," Traders.com Advantage, March 8, 2007). |

|
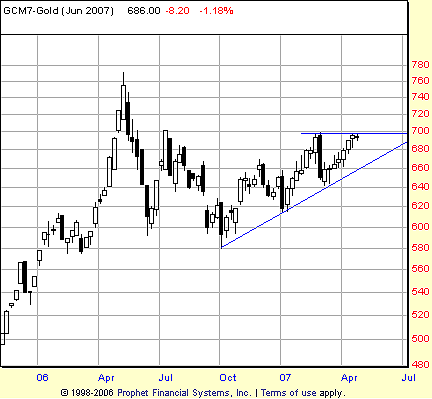
| FIGURE 1: GOLD, JUNE FUTURES, WEEKLY. The 700 level is one of three resistance levels that June gold will need to surpass en route to new, all-time, contract highs. |
| Graphic provided by: Prophet Financial, Inc. |
| |
| While it may turn out to be that an important bottom was created in October 2006, the "lower before higher" case proved incorrect, as gold futures put in a low in late February 2007 and began moving steadily, if modestly, higher. With the correction ending near 640, gold futures managed to climb more than 50 points (basis continuous futures) by late April. |
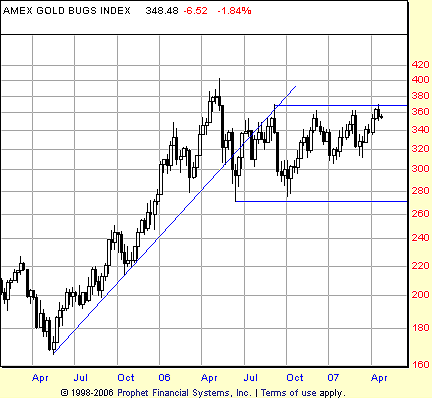
| There are two levels of resistance that bear watching. The first, more immediate resistance level can be found in the contract for June gold (Figure 1). Here, gold had been moving steadily higher in an attempt, ultimately, to take out the recent February highs and the 700 level. These February highs have already been bested by both the continuous futures contract and the index of unhedged gold stocks, the $HUI. However, the fact that the June gold contract is struggling to clear the 700 hurdle seems to dove-tail with the fact that both the continuous futures and the $HUI are fighting to move beyond an earlier, arguably more crucial resistance level in the form of the May 2006 highs (Figure 2). |
| The progress of continuous gold futures and the $HUI vis-a-vis the February 2007 highs suggests that June gold will eventually surpass the 2007 highs — though that is by no means certain. But I suspect the progress of June gold will be very much tied to the progress of these other two markets. If the $HUI and/or continuous gold futures fail to make new highs vis-a-vis 2006, then it is likely that June gold will fail as well — and perhaps as early as its attempt to take out the 2007 highs. |

|
| FIGURE 2: AMEX GOLD BUGS INDEX, WEEKLY. Trapped in a wide-ranging correction for at least three quarters, the $HUI is currently testing the top of that range for resistance. The high in the spring of 2006 — an all-time high — looms some 40-odd points higher. |
| Graphic provided by: Prophet Financial, Inc. |
| |
| A great deal rests on the ability of gold to set new highs. It has been argued that the sideways motion in gold stocks has had to do with the fact that investors are not completely convinced that the Federal Reserve is about to move from a rate-raising posture to a rate-cutting one. The thinking on this is clear: If the Fed moves to cut short-interest rates, adding liquidity to an economy that many think is already super-saturated, then gold is likely to move aggressively to the upside. If, on the other hand, the Fed adopts a more hawkish tone with regard to inflation, gold is much more likely to fail at tests of new highs, possibly even reversing and heading significantly lower. What is interesting is that virtually all of the major economies of the world are far more concerned about inflation — to the point of openly talking about short rate increases — than the Federal Reserve appears to be. In fact, it appears as if American economists have become convinced that there is no way the Fed can raise rates even if it wants to without crashing the economy. This, perhaps, adds more bullish bias to the fortunes of gold. But traders should make the yellow metal prove it by taking out near-term resistance and showing a little follow-through to the upside first. |
Technical Writer for Technical Analysis of STOCKS & COMMODITIES magazine, Working-Money.com, and Traders.com Advantage.
| Title: | Technical Writer |
| Company: | Technical Analysis, Inc. |
| Address: | 4757 California Avenue SW |
| Seattle, WA 98116 | |
| Phone # for sales: | 206 938 0570 |
| Fax: | 206 938 1307 |
| Website: | www.Traders.com |
| E-mail address: | DPenn@traders.com |
Traders' Resource Links | |
| Charting the Stock Market: The Wyckoff Method -- Books | |
| Working-Money.com -- Online Trading Services | |
| Traders.com Advantage -- Online Trading Services | |
| Technical Analysis of Stocks & Commodities -- Publications and Newsletters | |
| Working Money, at Working-Money.com -- Publications and Newsletters | |
| Traders.com Advantage -- Publications and Newsletters | |
| Professional Traders Starter Kit -- Software | |
Click here for more information about our publications!
Comments
Date: 04/26/07Rank: 3Comment:

Request Information From Our Sponsors
- StockCharts.com, Inc.
- Candle Patterns
- Candlestick Charting Explained
- Intermarket Technical Analysis
- John Murphy on Chart Analysis
- John Murphy's Chart Pattern Recognition
- John Murphy's Market Message
- MurphyExplainsMarketAnalysis-Intermarket Analysis
- MurphyExplainsMarketAnalysis-Visual Analysis
- StockCharts.com
- Technical Analysis of the Financial Markets
- The Visual Investor
- VectorVest, Inc.
- Executive Premier Workshop
- One-Day Options Course
- OptionsPro
- Retirement Income Workshop
- Sure-Fire Trading Systems (VectorVest, Inc.)
- Trading as a Business Workshop
- VectorVest 7 EOD
- VectorVest 7 RealTime/IntraDay
- VectorVest AutoTester
- VectorVest Educational Services
- VectorVest OnLine
- VectorVest Options Analyzer
- VectorVest ProGraphics v6.0
- VectorVest ProTrader 7
- VectorVest RealTime Derby Tool
- VectorVest Simulator
- VectorVest Variator
- VectorVest Watchdog
