HOT TOPICS LIST
- MACD
- Fibonacci
- RSI
- Gann
- ADXR
- Stochastics
- Volume
- Triangles
- Futures
- Cycles
- Volatility
- ZIGZAG
- MESA
- Retracement
- Aroon
INDICATORS LIST
LIST OF TOPICS
PRINT THIS ARTICLE
by Arthur Hill
Tech Data is firming at support, and traders should watch for a consolidation breakout to trigger the next signal.
Position: Hold
Arthur Hill
Arthur Hill is currently editor of TDTrader.com, a website specializing in trading strategies, sector/industry specific breadth stats and overall technical analysis. He passed the Society of Technical Analysts (STA London) diploma exam with distinction is a Certified Financial Technician (CFTe). Prior to TD Trader, he was the Chief Technical Analyst for Stockcharts.com and the main contributor to the ChartSchool.
PRINT THIS ARTICLE
SUPPORT & RESISTANCE
Tech Data Firms At Support
04/24/07 10:09:24 AMby Arthur Hill
Tech Data is firming at support, and traders should watch for a consolidation breakout to trigger the next signal.
Position: Hold
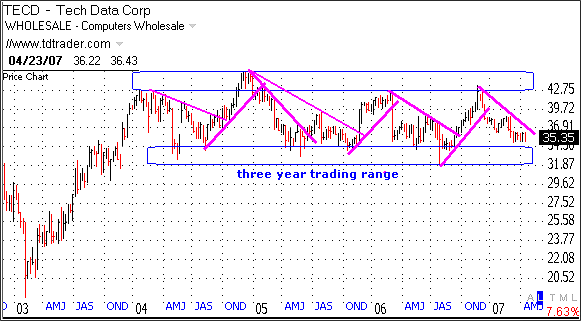
| Tech Data (TECD) has lots of support in the mid-30s, and this support zone extends back to 2004. In fact, the weekly chart shows that the stock has been locked in a trading range the last three years and is currently trading near range support (Figure 1). There have been at least six swings within this range and the current swing is down. The magenta trendlines shows these swings. With the stock trading at long-term support, traders should watch for a bounce and breakout to start the next upswing. |

|
| FIGURE 1: TECD, WEEKLY. The stock has been locked in a trading range the last three years and is currently trading near range support. |
| Graphic provided by: Telechart 2007. |
| |
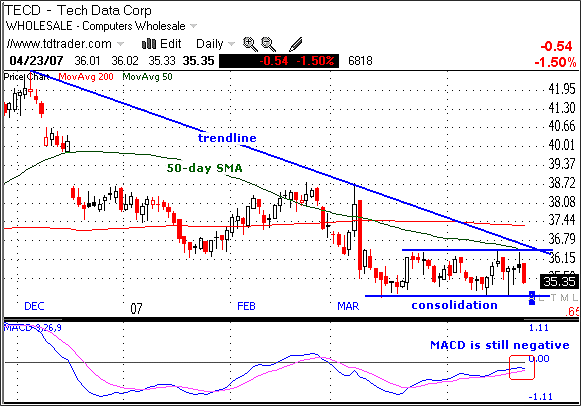
| On the daily chart, we can home in on the current downswing to identify a potential reversal (Figure 2). The stock declined to around 35 and then consolidated the last few weeks. The range has been pretty tight with support at 35 and resistance at 36.5. Resistance around 36.5 is also confirmed by the December trendline and the 50-day moving average. A break above this level would reverse the current downswing and target a move back to the resistance zone. An ideal breakout would occur as a strong surge on good volume. |

|
| FIGURE 2: TECD, DAILY. We can home in on the current downswing to identify a potential reversal. |
| Graphic provided by: Telechart 2007. |
| |
| While the stock consolidates at support, traders should keep in mind that this stock could also break to the downside. TECD declined sharply in March and then consolidated. Even though the stock is firming at support, it has yet to recover from this decline and a break below the consolidation lows would signal a continuation lower. This would target a move to the low 30s (31–32) and affirm resistance at 36.5. |
| I am also using the moving average convergence/divergence (MACD) to confirm an upside breakout or a downside break. The MACD is currently rising but remains in negative territory, and momentum is still bearish overall. A move into positive territory would be bullish for the MACD. Conversely, failure at the zero line and a move back below the signal line would be bearish for momentum. |
Arthur Hill is currently editor of TDTrader.com, a website specializing in trading strategies, sector/industry specific breadth stats and overall technical analysis. He passed the Society of Technical Analysts (STA London) diploma exam with distinction is a Certified Financial Technician (CFTe). Prior to TD Trader, he was the Chief Technical Analyst for Stockcharts.com and the main contributor to the ChartSchool.
| Title: | Editor |
| Company: | TDTrader.com |
| Address: | Willem Geetsstraat 17 |
| Mechelen, B2800 | |
| Phone # for sales: | 3215345465 |
| Website: | www.tdtrader.com |
| E-mail address: | arthurh@tdtrader.com |
Traders' Resource Links | |
| TDTrader.com has not added any product or service information to TRADERS' RESOURCE. | |
Click here for more information about our publications!
Comments
Date: 04/24/07Rank: 4Comment:
Date: 04/25/07Rank: 5Comment:

Request Information From Our Sponsors
- VectorVest, Inc.
- Executive Premier Workshop
- One-Day Options Course
- OptionsPro
- Retirement Income Workshop
- Sure-Fire Trading Systems (VectorVest, Inc.)
- Trading as a Business Workshop
- VectorVest 7 EOD
- VectorVest 7 RealTime/IntraDay
- VectorVest AutoTester
- VectorVest Educational Services
- VectorVest OnLine
- VectorVest Options Analyzer
- VectorVest ProGraphics v6.0
- VectorVest ProTrader 7
- VectorVest RealTime Derby Tool
- VectorVest Simulator
- VectorVest Variator
- VectorVest Watchdog
- StockCharts.com, Inc.
- Candle Patterns
- Candlestick Charting Explained
- Intermarket Technical Analysis
- John Murphy on Chart Analysis
- John Murphy's Chart Pattern Recognition
- John Murphy's Market Message
- MurphyExplainsMarketAnalysis-Intermarket Analysis
- MurphyExplainsMarketAnalysis-Visual Analysis
- StockCharts.com
- Technical Analysis of the Financial Markets
- The Visual Investor
