HOT TOPICS LIST
- MACD
- Fibonacci
- RSI
- Gann
- ADXR
- Stochastics
- Volume
- Triangles
- Futures
- Cycles
- Volatility
- ZIGZAG
- MESA
- Retracement
- Aroon
INDICATORS LIST
LIST OF TOPICS
PRINT THIS ARTICLE
by Chaitali Mohile
Infosys is trying to get back to its former highs. Whether it will give good trading opportunity as it does so is questionable.
Position: N/A
Chaitali Mohile
Active trader in the Indian stock markets since 2003 and a full-time writer. Trading is largely based upon technical analysis.
PRINT THIS ARTICLE
MOVING AVERAGES
Infosys Undergoes Volatile Rally
04/26/07 08:31:48 AMby Chaitali Mohile
Infosys is trying to get back to its former highs. Whether it will give good trading opportunity as it does so is questionable.
Position: N/A
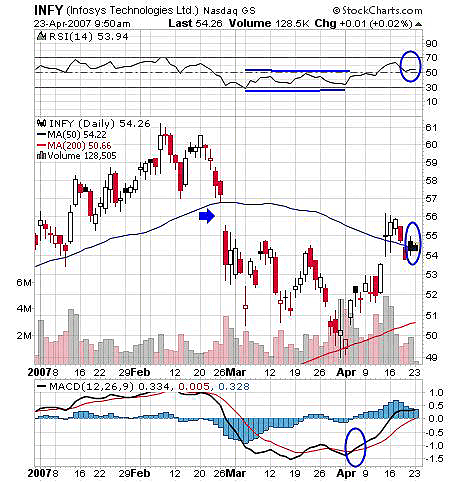
| Infosys, one of the leading technology stocks, is showing volatile moves for the last few months. The stock has moved about $30 from mid-2006 to February 2007, so this move might be just reaction or consolidation toward the initial 30-point bullish rally. But traders need to know at what level this stock can be traded again. During its correction phase, the 50-day moving average (MA) support was violated with a gap down, and thereafter, correcting further, the price tested a 200-day MA support in the longer term and with a stronger moving average support/resistance. |
| The trip from $48 to $54 began with this strong 200-day MA support. The 50-day MA was the resistance for the oncoming bullish rally. But this resistance turned in support only due to the encouraging volume during the rally from $48. |

|
| FIGURE 1: INFOSYS, DAILY. Here, the stock price stands on the support of the 50-day moving average. |
| Graphic provided by: SuperCharts. |
| |
| The relative strength index (RSI)(14) is comfortably above 50, indicating buying opportunities on this bullish rally. The moving average convergence/divergence (MACD) (12,26,9) is positive since the bullish crossover. The positive MACD is trying to cross its zero line, opening low-risk buying, and thus, both indicators combined makes a good long position possible. In addition, the price has the support of the 50-day MA. But the best trade is possible above $56, with a target of a previous high. |

|
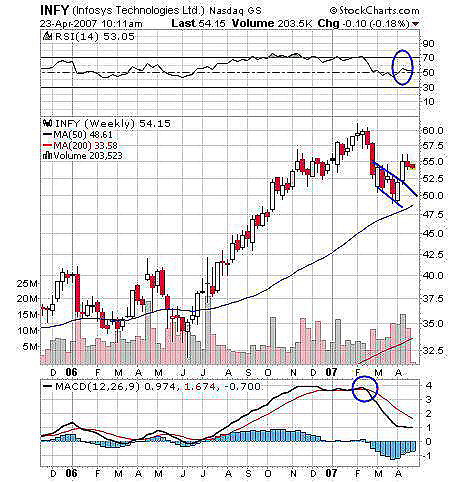
| FIGURE 2: INFOSYS, WEEKLY. The falling wedge breakout failed to move further. The possibility of testing the trendline support cannot be ignored. |
| Graphic provided by: StockCharts.com. |
| |
| A falling wedge was formed while the stock was correcting during the last few weeks. A bullish breakout on the wedge occurred with good volume but could not move further, so the price could plunge to the upper trendline of the wedge. The RSI(14) at 53 gives a buy signal, but the MACD (12,26,9) has a bearish crossover. In Figure 1, the daily chart, the MACD (12,26,9) gave a bullish crossover. The MACD (12,26,9) traders can first follow the price to move above $56 and then look for MACD signals. Figure 2, the weekly chart, has a 50-day MA as its first support. |
| Though Infosys is good among technology stocks, it should currently just be watched. A low-risk trade is possible only above $56, so this stock should top the watchlist of traders and investors. |
Active trader in the Indian stock markets since 2003 and a full-time writer. Trading is largely based upon technical analysis.
| Company: | Independent |
| Address: | C1/3 Parth Indraprasth Towers. Vastrapur |
| Ahmedabad, Guj 380015 | |
| E-mail address: | chaitalimohile@yahoo.co.in |
Traders' Resource Links | |
| Independent has not added any product or service information to TRADERS' RESOURCE. | |
Click here for more information about our publications!
Comments
Date: 04/26/07Rank: 4Comment:
Date: 05/01/07Rank: 1Comment:

Request Information From Our Sponsors
- VectorVest, Inc.
- Executive Premier Workshop
- One-Day Options Course
- OptionsPro
- Retirement Income Workshop
- Sure-Fire Trading Systems (VectorVest, Inc.)
- Trading as a Business Workshop
- VectorVest 7 EOD
- VectorVest 7 RealTime/IntraDay
- VectorVest AutoTester
- VectorVest Educational Services
- VectorVest OnLine
- VectorVest Options Analyzer
- VectorVest ProGraphics v6.0
- VectorVest ProTrader 7
- VectorVest RealTime Derby Tool
- VectorVest Simulator
- VectorVest Variator
- VectorVest Watchdog
- StockCharts.com, Inc.
- Candle Patterns
- Candlestick Charting Explained
- Intermarket Technical Analysis
- John Murphy on Chart Analysis
- John Murphy's Chart Pattern Recognition
- John Murphy's Market Message
- MurphyExplainsMarketAnalysis-Intermarket Analysis
- MurphyExplainsMarketAnalysis-Visual Analysis
- StockCharts.com
- Technical Analysis of the Financial Markets
- The Visual Investor
