HOT TOPICS LIST
- MACD
- Fibonacci
- RSI
- Gann
- ADXR
- Stochastics
- Volume
- Triangles
- Futures
- Cycles
- Volatility
- ZIGZAG
- MESA
- Retracement
- Aroon
INDICATORS LIST
LIST OF TOPICS
PRINT THIS ARTICLE
by Chaitali Mohile
$BKX is on moving average support but under previous high resistance. So although technical conditions on charts are positive, the resistance might change the picture.
Position: N/A
Chaitali Mohile
Active trader in the Indian stock markets since 2003 and a full-time writer. Trading is largely based upon technical analysis.
PRINT THIS ARTICLE
TECHNICAL ANALYSIS
Bank Index Under Test
04/24/07 10:54:56 AMby Chaitali Mohile
$BKX is on moving average support but under previous high resistance. So although technical conditions on charts are positive, the resistance might change the picture.
Position: N/A
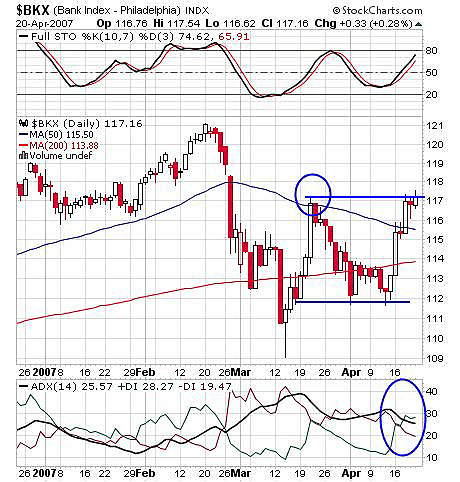
| The Philadelphia Banking Index ($BKX) began its bullish rally from mid-December 2004. After gaining about 20 points on this rally, the bank index made a high of $121 on March 20, 2007. Since then, the index has corrected sharply, losing some gains during the previous bullish rally. It violated the support of the 50-day moving average and an additional 200-day MA. The newly formed resistance added with negative world clues when during last month, $BKX failed to perform. On reaching the 50-day MA resistance, the index retraced to its previous low pivot and consolidated, forming a double bottom (Figure 1). A double bottom is a bullish indication, conveying a possible upside move in the index. Accordingly, the bank index traveled five points, from 112 to its previous high of 117. The previous high is a major resistance by itself in the bullish rally, so this high may result in either a consolidation or a dip in the bank index. |
| The stochastic oscillator has failed to move above 80 as the price was under the resistance of the 50-day moving average. Currently, the stochastic is 65, indicating plenty of bullish room for the index. The average directional movement index (ADX)(14) slips to 25 from 30, with +DI crossover from below. This is a bullish indication, indicating a developing uptrend. |

|
| FIGURE 1: $BKX, DAILY. The bank index faces previous high resistance that can lead to consolidation. |
| Graphic provided by: StockCharts.com. |
| |
| So both indicators highlight positive signals for $BKX to move ahead of its resistance line. With this indication, if the bank index moves ahead, its individual stock might see a good bullish rally. Now let's find what signals we get from the weekly chart (Figure 2). |

|
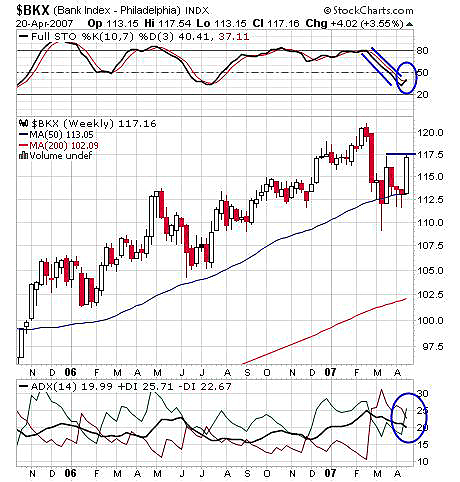
| FIGURE 2: $BKX, WEEKLY. $BKX has a strong bullish support of 50-day moving average, but the previous high pivot may react like a dictator. |
| Graphic provided by: StockCharts.com. |
| |
| The stochastic (10,7,3) dipped from the 80 level to 20, with the index correcting from 121 to 112. Figure 2 shows that the index stands on perfect support of the 50-day moving average. The bullish run during last week made the index touch its previous high at 117.5. The stochastic at 37.11 is giving a bullish signal by turning above 20. The ADX (14) has marginally moved below 20, indicating the possibility of consolidation in an uptrend. A strong uptrend will regain its strength if the ADX moves 25. |
| Considering both the daily and weekly charts, the $BKX is likely to continue its bullish rally. The previous high might make the index dip to its 50-day MA support in the daily frame. Traders might see an attractive bullish rally in banking stocks on violating this resistance by $BKX. |
Active trader in the Indian stock markets since 2003 and a full-time writer. Trading is largely based upon technical analysis.
| Company: | Independent |
| Address: | C1/3 Parth Indraprasth Towers. Vastrapur |
| Ahmedabad, Guj 380015 | |
| E-mail address: | chaitalimohile@yahoo.co.in |
Traders' Resource Links | |
| Independent has not added any product or service information to TRADERS' RESOURCE. | |
Click here for more information about our publications!
Comments
Date: 04/24/07Rank: 5Comment:
Date: 04/25/07Rank: 5Comment:

Request Information From Our Sponsors
- StockCharts.com, Inc.
- Candle Patterns
- Candlestick Charting Explained
- Intermarket Technical Analysis
- John Murphy on Chart Analysis
- John Murphy's Chart Pattern Recognition
- John Murphy's Market Message
- MurphyExplainsMarketAnalysis-Intermarket Analysis
- MurphyExplainsMarketAnalysis-Visual Analysis
- StockCharts.com
- Technical Analysis of the Financial Markets
- The Visual Investor
- VectorVest, Inc.
- Executive Premier Workshop
- One-Day Options Course
- OptionsPro
- Retirement Income Workshop
- Sure-Fire Trading Systems (VectorVest, Inc.)
- Trading as a Business Workshop
- VectorVest 7 EOD
- VectorVest 7 RealTime/IntraDay
- VectorVest AutoTester
- VectorVest Educational Services
- VectorVest OnLine
- VectorVest Options Analyzer
- VectorVest ProGraphics v6.0
- VectorVest ProTrader 7
- VectorVest RealTime Derby Tool
- VectorVest Simulator
- VectorVest Variator
- VectorVest Watchdog
