HOT TOPICS LIST
- MACD
- Fibonacci
- RSI
- Gann
- ADXR
- Stochastics
- Volume
- Triangles
- Futures
- Cycles
- Volatility
- ZIGZAG
- MESA
- Retracement
- Aroon
INDICATORS LIST
LIST OF TOPICS
PRINT THIS ARTICLE
by Chaitali Mohile
The materials sector has formed an ascending triangle. The high-volume breakout can lead to a new level of $42.
Position: Buy
Chaitali Mohile
Active trader in the Indian stock markets since 2003 and a full-time writer. Trading is largely based upon technical analysis.
PRINT THIS ARTICLE
ASCENDING TRIANGLES
XLB Edging Toward Breakout
04/23/07 09:56:02 AMby Chaitali Mohile
The materials sector has formed an ascending triangle. The high-volume breakout can lead to a new level of $42.
Position: Buy
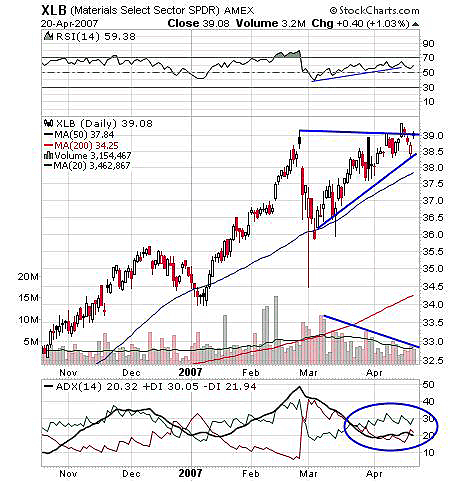
| The materials sector has been outperforming for about two years. This sector has given steady returns to its traders. XLB (the materials select sector SPDR) has formed an ascending triangle on the daily as well as the weekly time frames (Figures 1 and 2). The same formation on two different time frames reinforces the pattern and strengthens the breakout. According to the Figure 1, the sector is about to break out that will lead its individual equities to run strongly. XLB retraced to the 50-day moving average (MA) support from its high of $39, then moved in the direction and support of the 50-day MA, forming an ascending triangle. The volume has also diminished as the buyers' line moved toward the sellers' line, further narrowing the range. The breakout cannot be traded, as the pattern can fail and whipsaw the traders. |

|
| FIGURE 1: XLB, DAILY. The ascending triangle has been formed, but price has yet to break out. Huge volume breakout will see attractive price levels. |
| Graphic provided by: StockCharts.com. |
| |
| The relative strength index (RSI)(14) has made higher lows, gearing up the bullish rally while the triangle was formed. The RSI gives buying opportunities above 50. But since price has not actually broken out, traders should not take any long position. In addition, the doji candle was formed on April 20, 2007, indicating indecision. So though the breakout direction of this formation is upward, it cannot be traded until the price moves above $39 and stays there. The average directional movement index (ADX)(14) at 20 suggests a developing bullish trend. |
| The target on the ascending triangle is calculated measuring the length of the triangle. Here, the length is $3 ($39 - $36), so by adding $3 to the breakout level of $39, we get the level of $42. Hence, traders can buy this stock only after confirmed breakout above $39 with said target. |

|
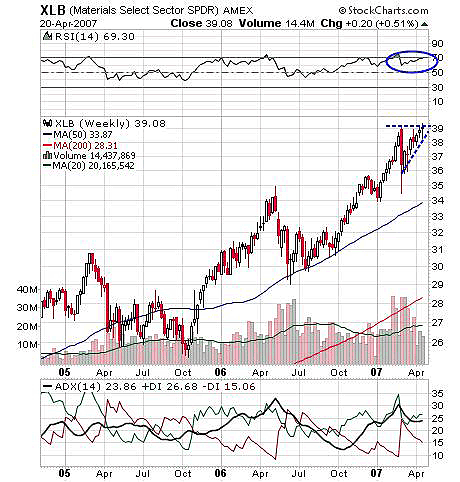
| FIGURE 2: XLB, WEEKLY. The ascending triangle also appears on the weekly chart. The same pattern on different time frames strengthens the formation and forthcoming rally. |
| Graphic provided by: StockCharts.com. |
| |
| The RSI(14) in Figure 2 marginally turned overbought and dropped to the 50 level, indicating a bullish strength in the rally. The strong sector/stock usually consolidates after the advance or a declining rally. Further, an ascending triangle is a bullish continuation pattern in an uptrend. Accordingly, XLB with its advance move from $34 to $39 consolidated, forming a triangle. The price dropped from $39 to $36 and then steadily moved toward the resistance line of the triangle. The ascending triangle on the weekly chart (Figure 2) enhances the bullish breakout. The ADX(14) indicates a developing uptrend. This good volume breakout will meet the target of $42. |
| Hence, the breakout above $39 in XLB can be bought and another stock from the same sector may also see a bullish run. In addition, the ascending triangle on two different time frames strengthens the upside move. |
Active trader in the Indian stock markets since 2003 and a full-time writer. Trading is largely based upon technical analysis.
| Company: | Independent |
| Address: | C1/3 Parth Indraprasth Towers. Vastrapur |
| Ahmedabad, Guj 380015 | |
| E-mail address: | chaitalimohile@yahoo.co.in |
Traders' Resource Links | |
| Independent has not added any product or service information to TRADERS' RESOURCE. | |
Click here for more information about our publications!
Comments
Date: 04/23/07Rank: 5Comment:

Request Information From Our Sponsors
- StockCharts.com, Inc.
- Candle Patterns
- Candlestick Charting Explained
- Intermarket Technical Analysis
- John Murphy on Chart Analysis
- John Murphy's Chart Pattern Recognition
- John Murphy's Market Message
- MurphyExplainsMarketAnalysis-Intermarket Analysis
- MurphyExplainsMarketAnalysis-Visual Analysis
- StockCharts.com
- Technical Analysis of the Financial Markets
- The Visual Investor
- VectorVest, Inc.
- Executive Premier Workshop
- One-Day Options Course
- OptionsPro
- Retirement Income Workshop
- Sure-Fire Trading Systems (VectorVest, Inc.)
- Trading as a Business Workshop
- VectorVest 7 EOD
- VectorVest 7 RealTime/IntraDay
- VectorVest AutoTester
- VectorVest Educational Services
- VectorVest OnLine
- VectorVest Options Analyzer
- VectorVest ProGraphics v6.0
- VectorVest ProTrader 7
- VectorVest RealTime Derby Tool
- VectorVest Simulator
- VectorVest Variator
- VectorVest Watchdog
