HOT TOPICS LIST
- MACD
- Fibonacci
- RSI
- Gann
- ADXR
- Stochastics
- Volume
- Triangles
- Futures
- Cycles
- Volatility
- ZIGZAG
- MESA
- Retracement
- Aroon
INDICATORS LIST
LIST OF TOPICS
PRINT THIS ARTICLE
by Gary Grosschadl
Nike Inc. has been in a rising pattern formation. Problem is, it's a bearish formation.
Position: Hold
Gary Grosschadl
Independent Canadian equities trader and technical analyst based in Peterborough
Ontario, Canada.
PRINT THIS ARTICLE
WEDGE FORMATIONS
Which Way Will Nike Run?
04/23/07 09:16:49 AMby Gary Grosschadl
Nike Inc. has been in a rising pattern formation. Problem is, it's a bearish formation.
Position: Hold
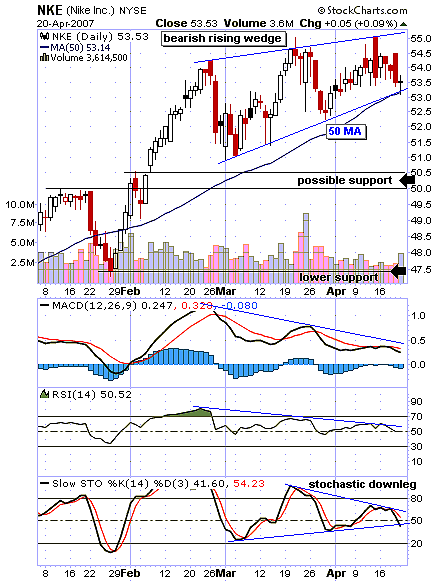
| This daily chart shows a rising wedge pattern that is a bearish pattern (Figure 1). More often than not, this pattern eventually breaks down and corrects lower. The opposite pattern, a bullish falling wedge, also often holds true, with a habit of reversing and heading up. This is a waiting game in which the stock must close below the lower trendline, ideally on large volume, before traders assume a downleg is beginning. |
| There is no measurement for a downside move, so previous support and resistance levels should be considered. Note how the 50-day simple moving average currently matches the lower trendline, making this level even more noteworthy. Two downside targets are considered. The region between $50 and $50.50 represents a previous resistance level and also a small gap. Should this level not hold, then a more serious downturn may take it to $47.50, the low on this chart. |

|
| FIGURE 1: NIKE, DAILY. This rising formation has a bearish tone. |
| Graphic provided by: StockCharts.com. |
| |
| Several indicators are worth considering. The moving average convergence/divergence (MACD) and the relative strength index (RSI) both show a big divergence to price action. As the stock made three higher peaks, these indicators headed the other way. This often foreshadows a coming correction, and technical traders have learned to heed positive and negative divergences. Finally, the stochastic oscillator shows a current downleg cracking below the often-key 50 threshold. Note how a symmetrical triangle can be drawn here. |
| In summary, watch for a break below the trendline to signal a possible downleg. If this happens, expect possible support near $50 or a temporary respite before heading even lower. Another possibility is a dip below the trendline and then a retest of the same line before heading down with more conviction. In addition, allow for the possibility that the price may decide to test the upper trendline again. It ain't over til it's over. |
Independent Canadian equities trader and technical analyst based in Peterborough
Ontario, Canada.
| Website: | www.whatsonsale.ca/financial.html |
| E-mail address: | gwg7@sympatico.ca |
Click here for more information about our publications!
Comments
Date: 04/23/07Rank: 5Comment:

|

Request Information From Our Sponsors
- StockCharts.com, Inc.
- Candle Patterns
- Candlestick Charting Explained
- Intermarket Technical Analysis
- John Murphy on Chart Analysis
- John Murphy's Chart Pattern Recognition
- John Murphy's Market Message
- MurphyExplainsMarketAnalysis-Intermarket Analysis
- MurphyExplainsMarketAnalysis-Visual Analysis
- StockCharts.com
- Technical Analysis of the Financial Markets
- The Visual Investor
- VectorVest, Inc.
- Executive Premier Workshop
- One-Day Options Course
- OptionsPro
- Retirement Income Workshop
- Sure-Fire Trading Systems (VectorVest, Inc.)
- Trading as a Business Workshop
- VectorVest 7 EOD
- VectorVest 7 RealTime/IntraDay
- VectorVest AutoTester
- VectorVest Educational Services
- VectorVest OnLine
- VectorVest Options Analyzer
- VectorVest ProGraphics v6.0
- VectorVest ProTrader 7
- VectorVest RealTime Derby Tool
- VectorVest Simulator
- VectorVest Variator
- VectorVest Watchdog
