HOT TOPICS LIST
- MACD
- Fibonacci
- RSI
- Gann
- ADXR
- Stochastics
- Volume
- Triangles
- Futures
- Cycles
- Volatility
- ZIGZAG
- MESA
- Retracement
- Aroon
INDICATORS LIST
LIST OF TOPICS
PRINT THIS ARTICLE
by David Penn
When does momentum really matter?
Position: N/A
David Penn
Technical Writer for Technical Analysis of STOCKS & COMMODITIES magazine, Working-Money.com, and Traders.com Advantage.
PRINT THIS ARTICLE
BREAKOUTS
BOSO And The S&P 500 Breakout
04/20/07 08:42:35 AMby David Penn
When does momentum really matter?
Position: N/A
| There are two important concepts when it comes to momentum: threshold and reversal. By threshold, I'm referring to that point where momentum reaches a level where it is capable of carrying prices further even as that momentum is waning. By reversal, I'm referring to that point when momentum carrying prices in a given direction becomes so weak that forces in the opposite direction are able to take control of the market for a given time. A perfect trader would be able to spot a reversal in a given market, take a position, recognize when that market has reached a momentum threshold, take partial profits and/or add to the position, spot a reversal, take full profits, and take a position in the opposite direction. |

|
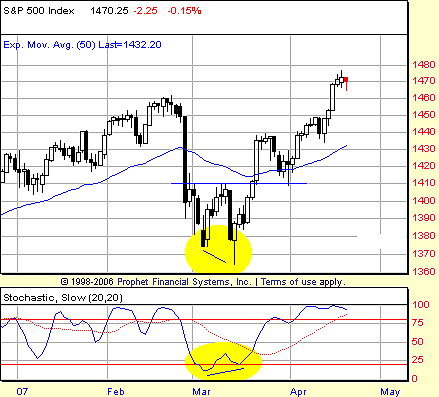
| FIGURE 1: S&P 500, DAILY. The positive divergence in the March lows of the S&P 500 was clear in a number of indicators, including the stochastic. |
| Graphic provided by: Prophet Financial, Inc. |
| |
| One of the things I like about the BOSO approach (see my Working-Money.com article, "BOSO," from October 5, 2005) is that it does an excellent job of indicating when a market has likely reached a momentum threshold. Everyone knows that markets that become overbought often remain overbought for a period, and that markets that become oversold often remain oversold for a period. So why not profit from this tendency by buying overbought markets and selling oversold ones? |
| There are caveats to this approach, such as only buying or selling above or below the intermediate-term moving average (20 to 50 period). But when combined with a strategy or method that aims to spot tops and bottoms — whether that strategy or method is pattern-based, cycles-based, or divergence/oscillator-based — the BOSO approach can be an excellent complement to a complete trading strategy. The last bottom I wrote about the stock market was in the QQQQ ("The QQQQ's Hourly Double Bottom And Successful Test," April 5, 2007). But consider a similar example in the Standard & Poor's 500 ("Short-Term 2B Bottom In The S&P 500," March 16, 2007). The double bottom that is a part of that 2B bottom projects to about 1450, while the buy signal from the 2B has the trader long around 1390. See Figure 1. |

|
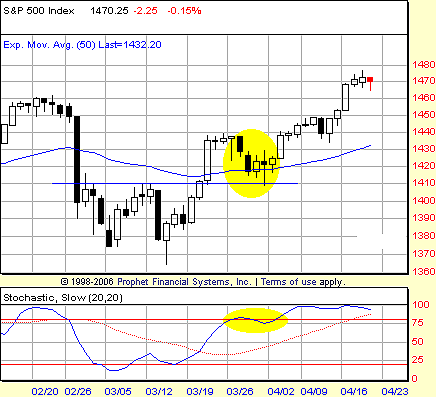
| FIGURE 2: S&P 500, DAILY. The highlighted oval indicates where the S&P 500 passed a momentum threshold, becoming overbought. Also highlighted is the area where the stock market pulled back to support, slipping below the threshold temporarily, before moving back through the threshold en route to higher prices. |
| Graphic provided by: Prophet Financial, Inc. |
| |
| The S&P 500 rallies up to 1440 with little problem. However, the market begins to run into resistance at that round number and cannot close above it. During that time, the market closes in overbought territory (Figure 2), indicating that it has passed through a momentum threshold to the upside. The market pulled back shortly thereafter. But a number of important things happened for the trader on the long side of this market. One, the pullback never closed below the intermediate-term moving averages (the 50-period). Two, when the market slipped temporarily out of overbought territory, there was no further follow-through to the downside. |
| In other words, when the market closed back outside of the overbought zone, it did not close below the low of that session again. In this example, the S&P 500 slipped out of the overbought zone on March 29. The low of that session was 1413. While the market traded lower than that on the following day, it did not close below 1413. The S&P was back in the overbought zone two days later, leading the market to new highs for the advance. Seven days after passing back into the momentum threshold, the 1450 target from the double bottom was reached. |
Technical Writer for Technical Analysis of STOCKS & COMMODITIES magazine, Working-Money.com, and Traders.com Advantage.
| Title: | Technical Writer |
| Company: | Technical Analysis, Inc. |
| Address: | 4757 California Avenue SW |
| Seattle, WA 98116 | |
| Phone # for sales: | 206 938 0570 |
| Fax: | 206 938 1307 |
| Website: | www.Traders.com |
| E-mail address: | DPenn@traders.com |
Traders' Resource Links | |
| Charting the Stock Market: The Wyckoff Method -- Books | |
| Working-Money.com -- Online Trading Services | |
| Traders.com Advantage -- Online Trading Services | |
| Technical Analysis of Stocks & Commodities -- Publications and Newsletters | |
| Working Money, at Working-Money.com -- Publications and Newsletters | |
| Traders.com Advantage -- Publications and Newsletters | |
| Professional Traders Starter Kit -- Software | |
Click here for more information about our publications!
Comments
Date: 04/20/07Rank: 3Comment:

Request Information From Our Sponsors
- StockCharts.com, Inc.
- Candle Patterns
- Candlestick Charting Explained
- Intermarket Technical Analysis
- John Murphy on Chart Analysis
- John Murphy's Chart Pattern Recognition
- John Murphy's Market Message
- MurphyExplainsMarketAnalysis-Intermarket Analysis
- MurphyExplainsMarketAnalysis-Visual Analysis
- StockCharts.com
- Technical Analysis of the Financial Markets
- The Visual Investor
- VectorVest, Inc.
- Executive Premier Workshop
- One-Day Options Course
- OptionsPro
- Retirement Income Workshop
- Sure-Fire Trading Systems (VectorVest, Inc.)
- Trading as a Business Workshop
- VectorVest 7 EOD
- VectorVest 7 RealTime/IntraDay
- VectorVest AutoTester
- VectorVest Educational Services
- VectorVest OnLine
- VectorVest Options Analyzer
- VectorVest ProGraphics v6.0
- VectorVest ProTrader 7
- VectorVest RealTime Derby Tool
- VectorVest Simulator
- VectorVest Variator
- VectorVest Watchdog
